
FIGURE
Fig. 8 S2
- ID
- ZDB-FIG-161219-17
- Publication
- Nicolás-Pérez et al., 2016 - Analysis of cellular behavior and cytoskeletal dynamics reveal a constriction mechanism driving optic cup morphogenesis
- Other Figures
- All Figure Page
- Back to All Figure Page
Fig. 8 S2
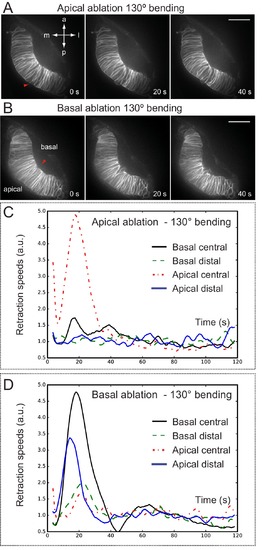
Optical flow analysis of retinal tissue displacement upon apical vs basal laser ablation. (A–B) Laser ablation experiments at the apical (A) or basal (B) surfaces of the retina in wild-type embryos. Red arrowheads indicate the ablation point. Scale bar = 50 µm. (C–D) Tissue retraction speed profiles at different retinal positions (color-coded) are represented for apical (C) vs basal (D) ablations. |
Expression Data
Expression Detail
Antibody Labeling
Phenotype Data
Phenotype Detail
Acknowledgments
This image is the copyrighted work of the attributed author or publisher, and
ZFIN has permission only to display this image to its users.
Additional permissions should be obtained from the applicable author or publisher of the image.
Full text @ Elife