
Fig. 3
- ID
- ZDB-FIG-161219-7
- Publication
- Nicolás-Pérez et al., 2016 - Analysis of cellular behavior and cytoskeletal dynamics reveal a constriction mechanism driving optic cup morphogenesis
- Other Figures
- All Figure Page
- Back to All Figure Page
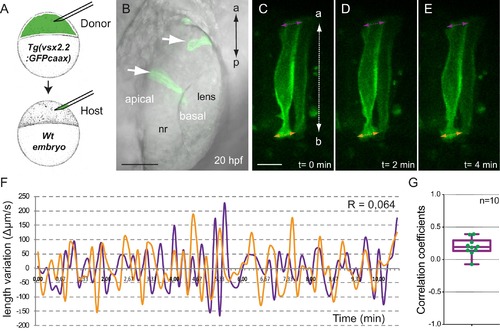
Analysis of tg(vsx2.2:GFP-caax) clones show uncoupled oscillations at apical and basal surfaces. (A) Scheme of transplantation experiment at sphere stage. (B) Confocal microscopy image showing transmitted light and GFP expression for transplanted clones (white arrows) at 20 hpf. Antero-posterior (a–p) axis is indicated. (C–E) Confocal microscopy time-lapse images show length variation of basal (orange) and apical (purple) edges through time in a transplanted clone. The orientation of the apico-basal (a–b) axis is indicated. Scale bars = 50 µm in B and 10 µm in C–E. (F) Quantification of the basal (orange) and apical (purple) length variation for an individual clone showing no correlation between the oscillations (R = 0064). (G) Box plot showing the distribution of apical vs basal oscillations correlation coefficients for 10 transplanted neuroblasts from five different retinas. |