
Fig. 8
- ID
- ZDB-FIG-161219-15
- Publication
- Nicolás-Pérez et al., 2016 - Analysis of cellular behavior and cytoskeletal dynamics reveal a constriction mechanism driving optic cup morphogenesis
- Other Figures
- All Figure Page
- Back to All Figure Page
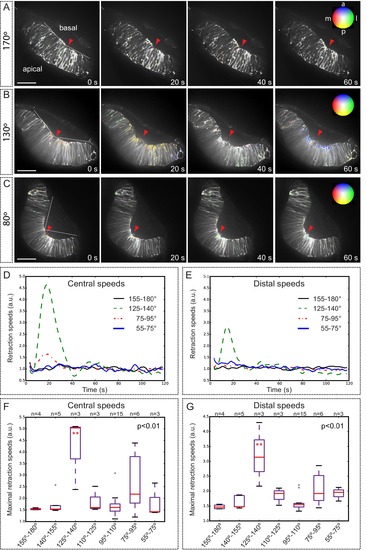
Optical flow analysis of tissue displacement upon laser ablation at different stages of folding. (A–C) Analysis of pixel displacement after laser ablation at the basal surface is shown for retinas at 170°, 130°, and 80° of bending. Red arrowheads indicate the ablation point. Particles’ motion vectors are indicated with a color code: Colors correspond to the direction of the displacement and color intensity to its magnitude. Note maximum displacement 20 s after ablation in 130°-stage retina. Scale bar = 50 µm. See Video 12. (D–E) Average tissue retraction speed profiles over time are shown for different stages of optic cup folding (represented as angle bins), both at the central (D) or distal (E) positions in the retina. (F–G) Box plot representation of maximal retraction speeds at the different stages, represented as angle bins. For each stage, median values (red bars) and sample sizes are indicated. One-way ANOVA analysis followed by Dunnett’s multiple comparison tests show significant differences (p<0.01**) only at 125–140º-stage. |