
Fig. 1
- ID
- ZDB-FIG-161202-9
- Publication
- Bernut et al., 2016 - Mycobacterium abscessus-Induced Granuloma Formation Is Strictly Dependent on TNF Signaling and Neutrophil Trafficking
- Other Figures
- All Figure Page
- Back to All Figure Page
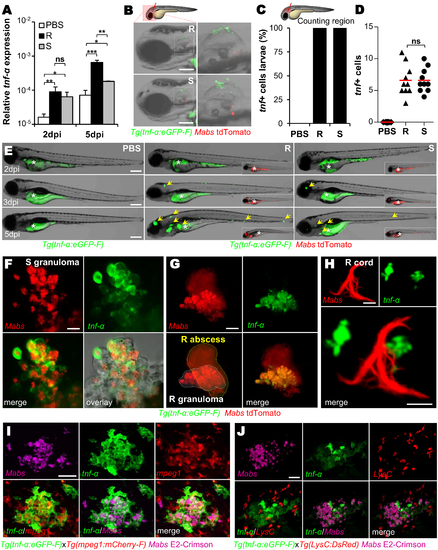
Expression of TNF by macrophages during Mabs infection. (A) Measurement of relative tnf-α expression by qRT-PCR using ef1α as a reference gene in whole embryo over PBS. Around 150 Mabs R or S variants were iv injected and assessed at 2 and 5 dpi. Mean log10 value of three independent experiments with error bars representing the standard error of the mean (SEM). (B-D) Tg(tnf-α:eGFP-F) larvae were injected in the otic cavity with ≈100 Mabs R or S variants (tdTomato) or with PBS. (B) Bright-field and fluorescence overlay microscopy showing the representative expression of tnf close to the injection site at 2 hpi. Scale bars, 100 μm. (C-D) Mean proportion of infected larvae with tnf+ cells (n = 10) (C) and quantification of tnf+ cells per infected larvae (each symbol represents individual embryos and horizontal lines indicate the mean values) (D) in (C) after 2 hpi. The data are representative of two experiments. (E) Distribution of tnfα-expressing cells revealed by the tnf-α:eGFP-F reporter transgene (arrows) in whole Tg(tnf-α:eGFP-F) larvae imaged live at the indicated time points post iv injection of PBS, Mabs R or S (tdTomato, ≈150 colony forming units (CFU)). The yolk (*) is auto-fluorescent. Scale bars, 200 μm. (F-H) Confocal images showing the representative tnf expression in a 3 dpi-granuloma (F) (scale bar, 20 μm), in a 5 dpi-brain abscess (G) (scale bar, 50 μm) or close to a 3 dpi-cord (H) (scale bars, 20 μm) in Tg(tnf-α:eGFP-F) embryos iv infected with Mabs R (tdTomato). (I-J) Confocal microscopy of a 3 dpi-granuloma showing the tnf expression in Tg(tnf-α:eGFP-F/mpeg1:mCherryF) (I) or Tg(tnf-α:eGFP-F/LysC:DsRed) (J) double transgenic embryos iv infected with Mabs R (E2-Crimson). Scale bars, 50 μm. Statistical significance was determined by Kruskal-Wallis test with Dunns post-test (A), Fisher’s exact test of a contingency table (C) or one-tailed unpaired Student’s t test (D). |
| Genes: | |
|---|---|
| Fish: | |
| Condition: | |
| Anatomical Terms: | |
| Stage Range: | Protruding-mouth to Days 7-13 |
| Fish: | |
|---|---|
| Condition: | |
| Observed In: | |
| Stage Range: | Protruding-mouth to Days 7-13 |