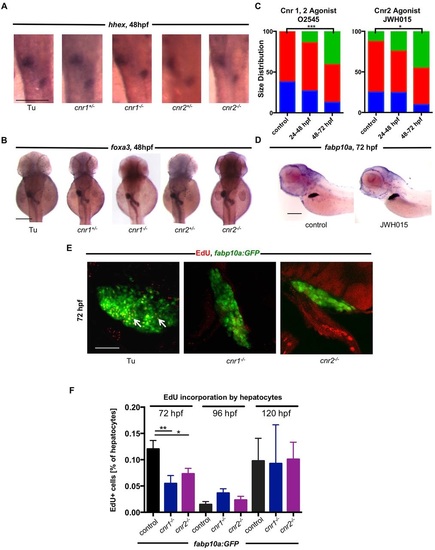
Hepatocyte proliferation is disrupted in Cnr mutants without impairment of hepatic progenitors. (A) ISH for hhex at 48hpf in WT (16 abnormal/89 observed), cnr1+/- (6/28 abnormal), cnr2+/- (5/32 abnormal), cnr1-/- (19/70 abnormal) and cnr2-/- (7/35 abnormal) embryos, revealing no significant differences in the hepatic progenitor population. (B) foxa3 ISH at 48hpf in WT (19/96 abnormal), cnr1+/- (4/29 abnormal), cnr2+/- (5/30 abnormal), cnr1-/- (12/54 abnormal) and cnr2-/- (4/40 abnormal) embryos, showing no differences in the endoderm population. (C) Relative frequency of liver size distribution of zebrafish embryos treated with Cnr agonists during different stages of liver development, as assessed by fabp10a expression at 72hpf. Treatment with the Cnr1/2 agonist O2545 (1µM) or the Cnr2 agonist JWH015 (1µM) only from 48-72hpf increased liver size, whereas earlier treatment had no effect. Normal liver size, red; small liver, blue; large liver, green. n>30 embryos. Chi-squared analysis. O2545, ***P<0.001 control versus 48-72hpf treatment; JWH015, *P<0.05 control versus 48-72hpf treatment. (D) Treatment with JWH015 from 48-72hpf increases fabp10a expression in zebrafish embryos at 72hpf. (E) Confocal projections of fabp10a:GFP livers at 72hpf after EdU incorporation. EdU-positive hepatocytes are represented by colocalization (arrows) of red EdU staining and hepatocyte-specific GFP expression. (F) FACS quantification of EdU-positive cells as a percentage of the GFP+ population at 72, 96 and 120hpf. At 72hpf there is less EdU incorporation compared with controls, indicating a decreased proliferation rate. At 96 and 120hpf, there is no difference in the proliferation rate. Mean±s.e.m., n=3-8 samples of ten pooled embryos. One-way ANOVA with Holm-Sidak′s multiple comparison test. At 72hpf, *P<0.01 for control versus cnr1-/-; fabp10a:GFP and **P<0.05 for control versus cnr2-/-; fabp10a:GFP. Scale bars: 0.2mm in A,B,D; 20µm in E.
|
