
Fig. S1
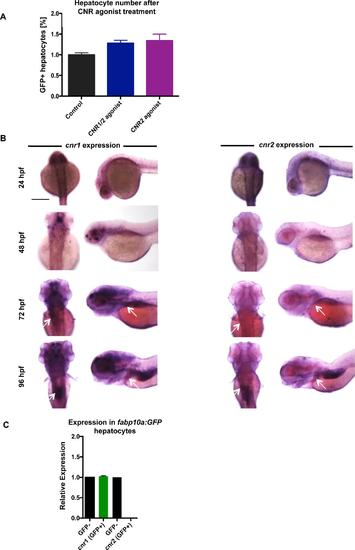
Cannabinoid receptor expression in the developing zebrafish A) FACS quantification of GFP-positive hepatocytes in fabp10a:GFP embryos treated with cannabinoid agonists from 24-72hpf. % of GFP positive cells were normalized to controls. Mean±s.e.m., n=5 groups of 10 pooled embryos; p=0.08, one-way ANOVA analysis. B) Dorsal and lateral in situ hybridization images at 24, 48, and 72hpf showing that cnr1 and cnr2 are expressed in the developing central nervous system, endoderm (arrow), and liver regions (arrow). Scale bar = 0.2 mm. C) qRT-PCR detects cnr1 expression in pooled FACS-sorted GFP-positive cells (~200,000 cells) from wild type fabp10a:GFP normalized to expression in the GFP-negative cell fraction, which includes the central nervous system. cnr2 is detectable in the non-hepatocyte (GFP-negative) fraction, but not in the hepatocytes. |
| Genes: | |
|---|---|
| Fish: | |
| Anatomical Terms: | |
| Stage Range: | Prim-5 to Day 4 |
| Fish: | |
|---|---|
| Condition: | |
| Observed In: | |
| Stage: | Protruding-mouth |