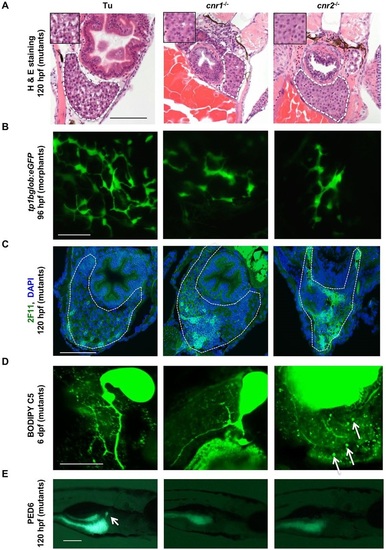
Livers in Cnr mutants eventually develop to normal size but continue to exhibit architectural and metabolic defects. (A) H&E-stained transverse sections through 120hpf larvae reveal altered hepatocyte morphology in cnr1-/- and cnr2-/- mutants, with more dense cytoplasm and decreased nucleus-to-cytoplasm ratios compared with WT, but no difference in hepatocyte size. Liver is outlined (white dashed line) and inset shows hepatocytes at higher magnification. (B) Confocal projections at 96hpf in cnr1 or cnr2 morphants in the tp1bglob:eGFP Notch transgenic background, showing smaller liver size and decreased biliary branching and bile duct formation versus the control (6/10 cnr1 morphants, 6/8 cnr2 morphants). (C) Transverse sections of 120hpf larvae stained with the biliary marker 2F11 and DAPI show an abnormal biliary tree in cnr1-/- (6/8 abnormal) and cnr2-/- (3/4 abnormal) livers. Liver region is outlined. (D) Confocal microscopy of livers in WT, cnr1-/- and cnr2-/- larvae at 6dpf, showing metabolism of BODIPY C5 throughout the biliary tree. cnr1-/- larvae have decreased biliary branching (n=6/8 with phenotype of this representative image), while cnr2-/- livers are characterized by lipid deposits (arrows, n=7 /10 abnormal), as compared with WT (0/12). (E) PED6 lipase reporter assay in cnr1-/- (n=18/40 abnormal) and cnr2-/- (n=7/24 abnormal) mutants demonstrates decreased fluorescence compared with controls (n=0/24 abnormal) at 120hpf. Fisher′s exact test. cnr1-/- versus WT, P<0.0001; cnr2-/- versus WT, P=0.0094. Arrow marks the gallbladder, which does not fluoresce in the mutants. Scale bars: 0.1mm in A,C; 20µm in B,D; 0.2mm in E.
|
