|
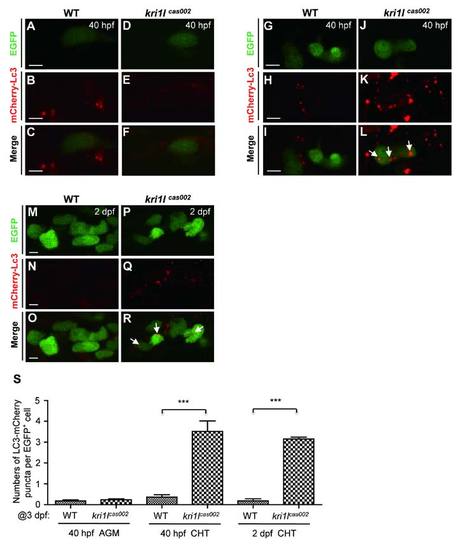
The comparison of autophagic level between kri1lcas002 mutants and wild-type siblings during hematopoietic development. Representative confocal images of mCherry–Lc3 puncta (autophagosomes) in HSPCs of live zebrafish embryos in different time points and regions, including the AGM at 40 hpf (A-F) (Scale bars: 5 µm.); the CHT at 40 hpf (G-L) (Scale bars: 5 µm.), and at 2 dpf (M-R) (Scale bars: 5 µm.). (S) Statistic analysis of the autophagy index (the average number of autophagosomes per HSPC) for kri1lcas002 mutants and wild-type siblings during hematopoietic development (40 hpf-2 dpf) mCherry–Lc3 puncta were counted over 20 EGFP+ cells (in the Tg(cmyb:egfp) background) in 5-8 individual embryos under each condition. 40 hpf AGM, p=0.4272; 40 hpf CHT, p<0.0001; 2 dpf CHT, p<0.0001. Error bars represent standard error of the mean (SEM). **, P0.01; ***, P≤0.001 (Student t test).
|