
Fig. 5
- ID
- ZDB-FIG-150612-5
- Publication
- Hall et al., 2013 - Immunoresponsive Gene 1 Augments Bactericidal Activity of Macrophage-Lineage Cells by Regulating β-Oxidation-Dependent Mitochondrial ROS Production
- Other Figures
- All Figure Page
- Back to All Figure Page
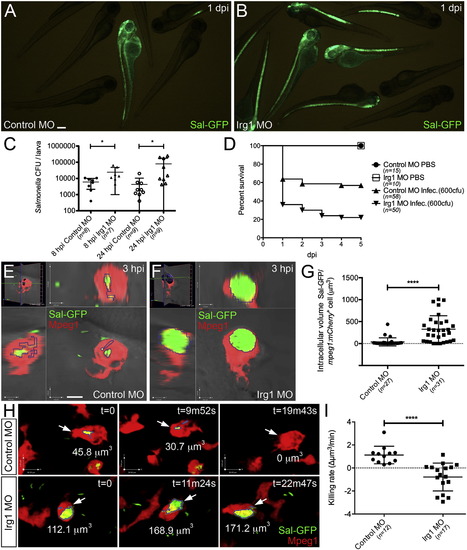
Irg1-Depleted Macrophage-Lineage Cells Demonstrate Diminished Bactericidal Activity (A and B) Live imaging of control MO-injected and Irg1-depleted larvae, respectively, following infection with Sal-GFP, imaged at 1 dpi. (C) CFU counts of remaining Sal-GFP within individual infected control MO-injected and Irg1-depleted larvae quantified at 8 and 24 hpi (mean ± SD). (D) Survival graph demonstrating percentage survival of control MO-injected PBS-injected, Irg1-depleted PBS-injected, control MO-injected infected, and Irg1-depleted infected larvae from 1 to 5 dpi. (E and F) Live confocal imaging of Sal-GFP within macrophage-lineage cells (within the midbrain/hindbrain region) of control MO-injected and Irg1-depleted Tg(mpeg1:mCherry) larvae, at 3 hpi, respectively. (G) Quantification of intracellular Sal-GFP burden within individual macrophage-lineage cells as shown in (E) and (F) (measured as total intracellular volume of Sal-GFP per mpeg1+ cell, mean ± SD). (H) Representative frames from live time-lapse confocal imaging of Sal-GFP infected macrophage-lineage cells within the midbrain/hindbrain region of control MO-injected and Irg1-depleted larvae (imaging starts at 3 hpi). White arrows mark tracked infected macrophage-lineage cell. Intracellular bacterial volume within tracked cells is displayed as µm3 within each time point. (I) Quantification of killing rate (change in Sal-GFP bacterial volume/time, Δµm3/min) of tracked infected macrophage-lineage cells, as shown in (H) (mean ± SD). Scale bars, 200 µm in (A); 5 µm in (E). p < 0.05; p < 0.0001. See also Figure S5. |
| Gene: | |
|---|---|
| Fish: | |
| Condition: | |
| Knockdown Reagent: | |
| Anatomical Term: | |
| Stage: | Long-pec |
| Fish: | |
|---|---|
| Condition: | |
| Knockdown Reagent: | |
| Observed In: | |
| Stage Range: | Long-pec to Days 7-13 |
Reprinted from Cell Metabolism, 18(2), Hall, C.J., Boyle, R.H., Astin, J.W., Flores, M.V., Oehlers, S.H., Sanderson, L.E., Ellett, F., Lieschke, G.J., Crosier, K.E., and Crosier, P.S., Immunoresponsive Gene 1 Augments Bactericidal Activity of Macrophage-Lineage Cells by Regulating β-Oxidation-Dependent Mitochondrial ROS Production, 265-278, Copyright (2013) with permission from Elsevier. Full text @ Cell Metab.