
Fig. 5
- ID
- ZDB-IMAGE-150612-5
- Genes
- Publication
- Hall et al., 2013 - Immunoresponsive Gene 1 Augments Bactericidal Activity of Macrophage-Lineage Cells by Regulating β-Oxidation-Dependent Mitochondrial ROS Production
- All Figures
- Figures for Hall et al., 2013
|
Fig. 5
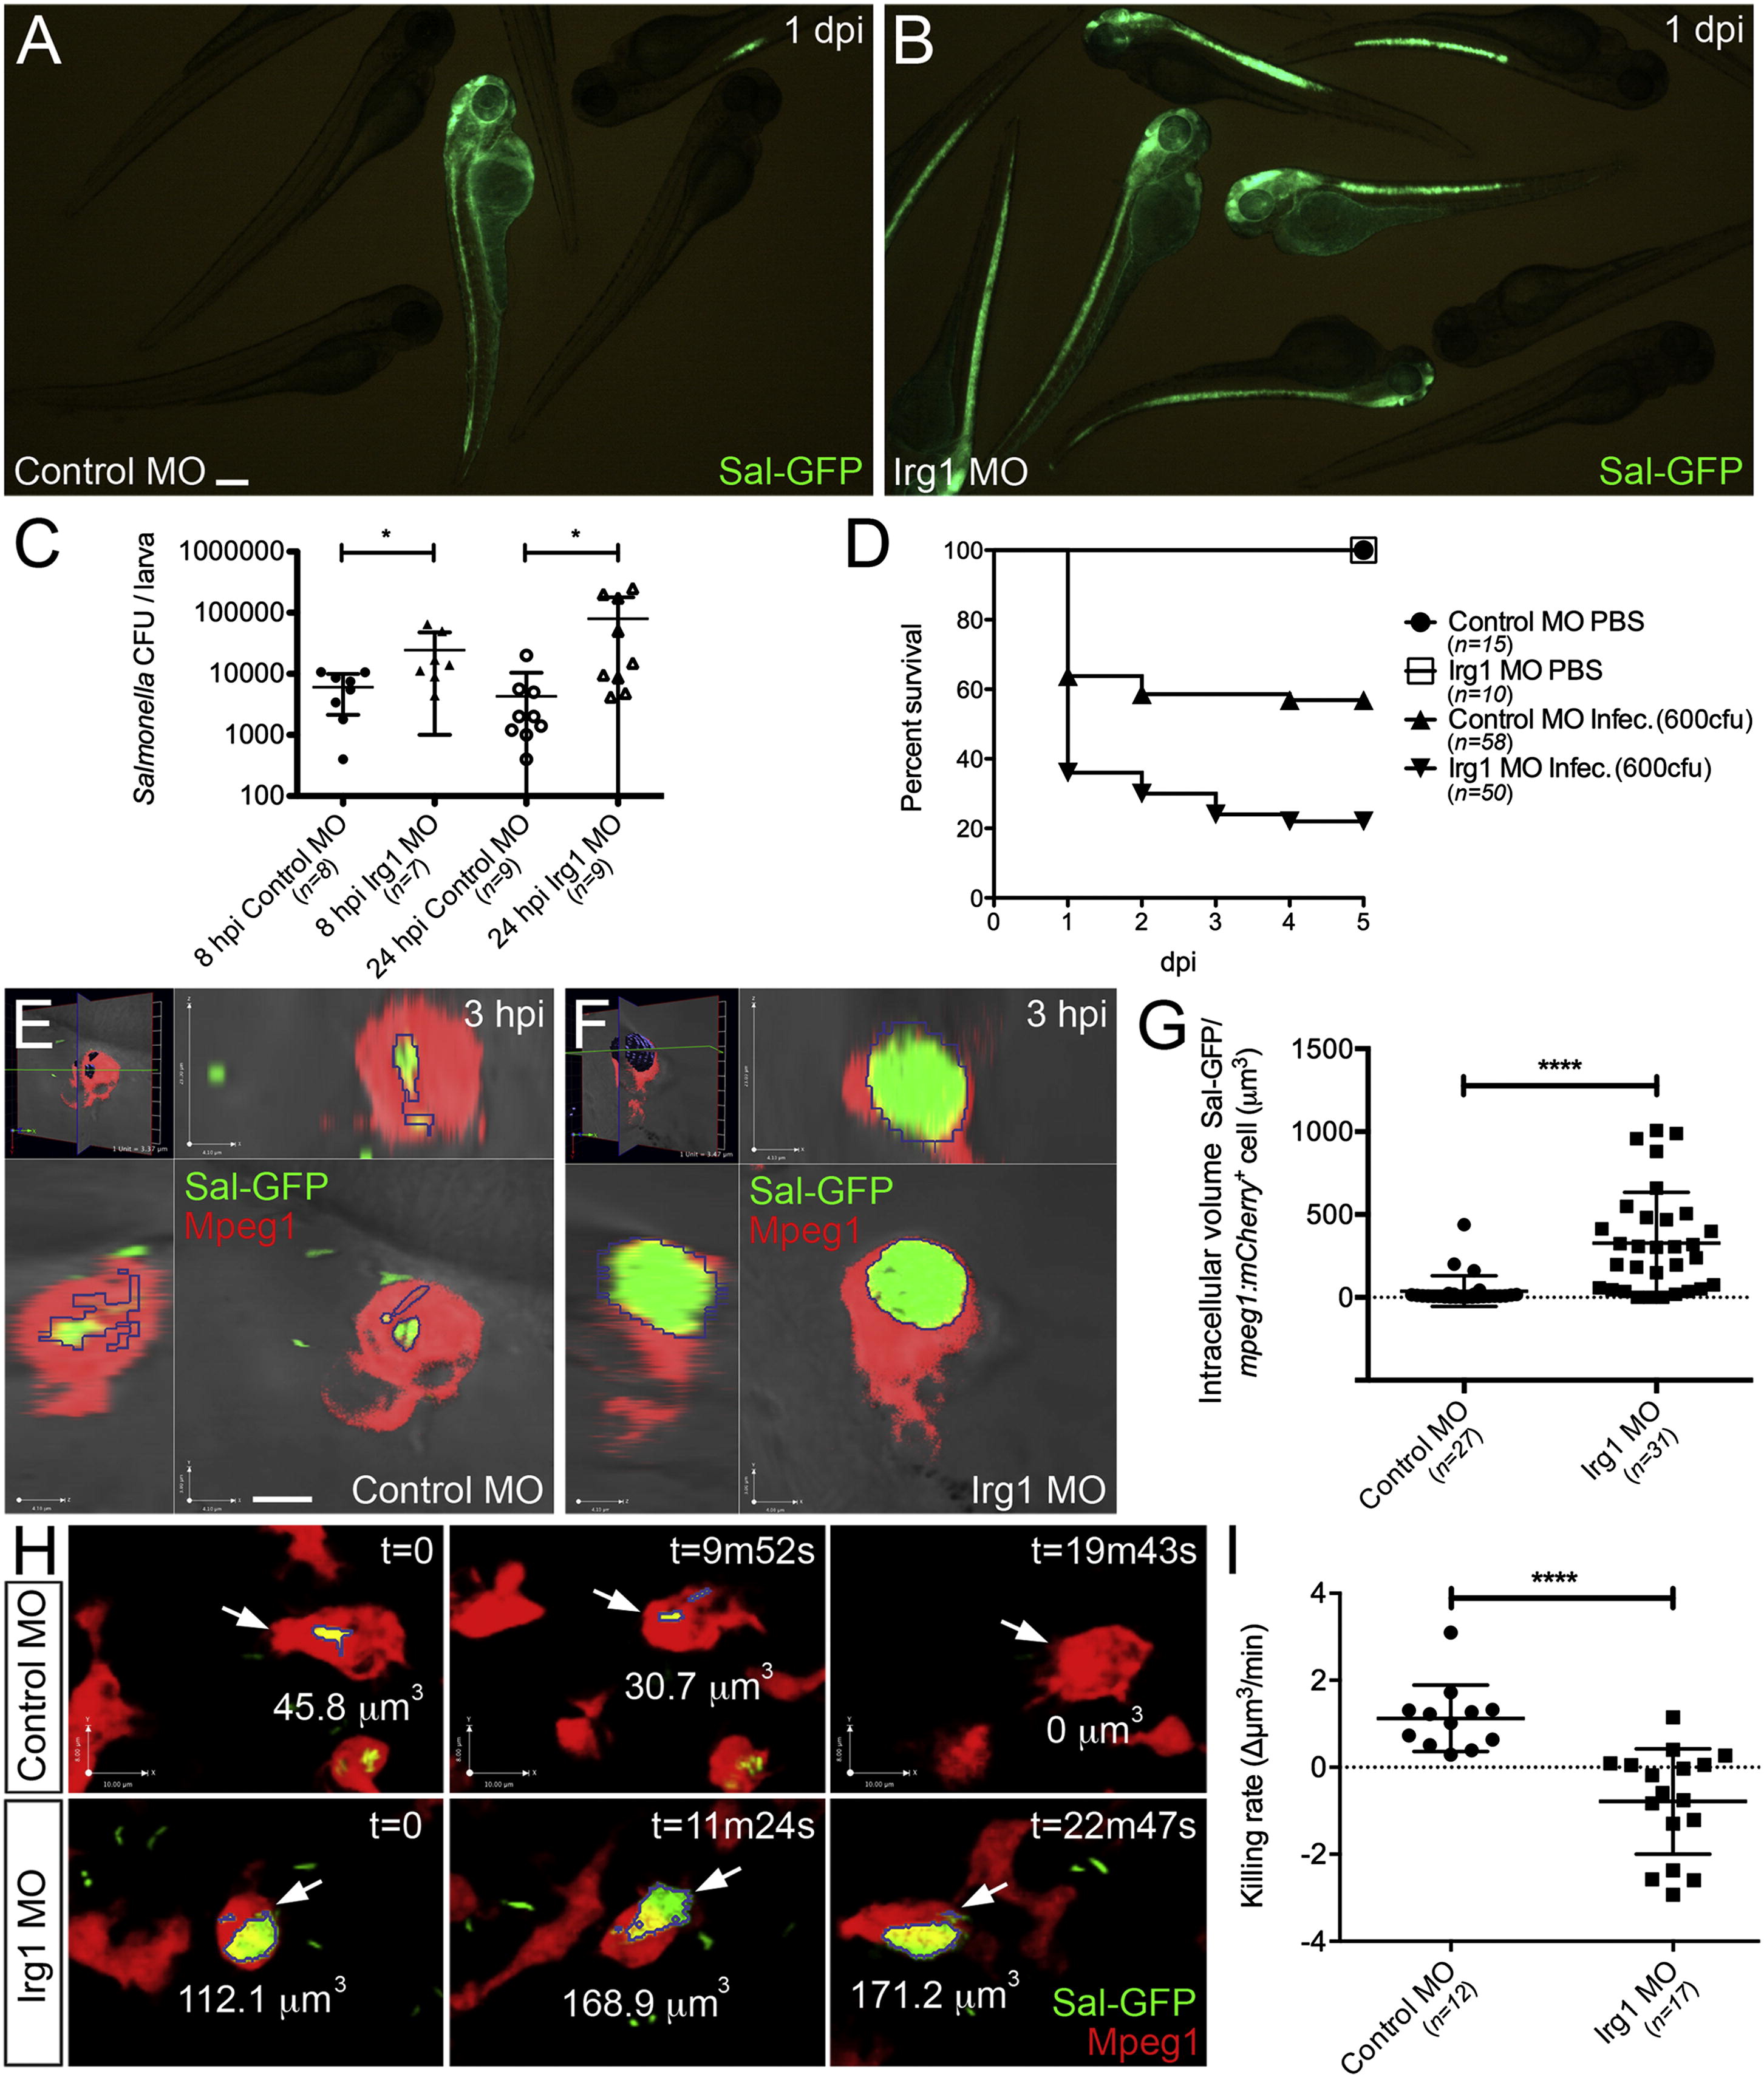
Irg1-Depleted Macrophage-Lineage Cells Demonstrate Diminished Bactericidal Activity
(A and B) Live imaging of control MO-injected and Irg1-depleted larvae, respectively, following infection with Sal-GFP, imaged at 1 dpi.
(C) CFU counts of remaining Sal-GFP within individual infected control MO-injected and Irg1-depleted larvae quantified at 8 and 24 hpi (mean ± SD).
(D) Survival graph demonstrating percentage survival of control MO-injected PBS-injected, Irg1-depleted PBS-injected, control MO-injected infected, and Irg1-depleted infected larvae from 1 to 5 dpi.
(E and F) Live confocal imaging of Sal-GFP within macrophage-lineage cells (within the midbrain/hindbrain region) of control MO-injected and Irg1-depleted Tg(mpeg1:mCherry) larvae, at 3 hpi, respectively.
(G) Quantification of intracellular Sal-GFP burden within individual macrophage-lineage cells as shown in (E) and (F) (measured as total intracellular volume of Sal-GFP per mpeg1+ cell, mean ± SD).
(H) Representative frames from live time-lapse confocal imaging of Sal-GFP infected macrophage-lineage cells within the midbrain/hindbrain region of control MO-injected and Irg1-depleted larvae (imaging starts at 3 hpi). White arrows mark tracked infected macrophage-lineage cell. Intracellular bacterial volume within tracked cells is displayed as µm3 within each time point.
(I) Quantification of killing rate (change in Sal-GFP bacterial volume/time, Δµm3/min) of tracked infected macrophage-lineage cells, as shown in (H) (mean ± SD). Scale bars, 200 µm in (A); 5 µm in (E). p < 0.05; p < 0.0001. See also Figure S5.
Reprinted from Cell Metabolism, 18(2), Hall, C.J., Boyle, R.H., Astin, J.W., Flores, M.V., Oehlers, S.H., Sanderson, L.E., Ellett, F., Lieschke, G.J., Crosier, K.E., and Crosier, P.S., Immunoresponsive Gene 1 Augments Bactericidal Activity of Macrophage-Lineage Cells by Regulating β-Oxidation-Dependent Mitochondrial ROS Production, 265-278, Copyright (2013) with permission from Elsevier. Full text @ Cell Metab.