
Fig. 2
- ID
- ZDB-FIG-150603-1
- Publication
- Tarbashevich et al., 2015 - Chemokine-Dependent pH Elevation at the Cell Front Sustains Polarity in Directionally Migrating Zebrafish Germ Cells
- Other Figures
- All Figure Page
- Back to All Figure Page
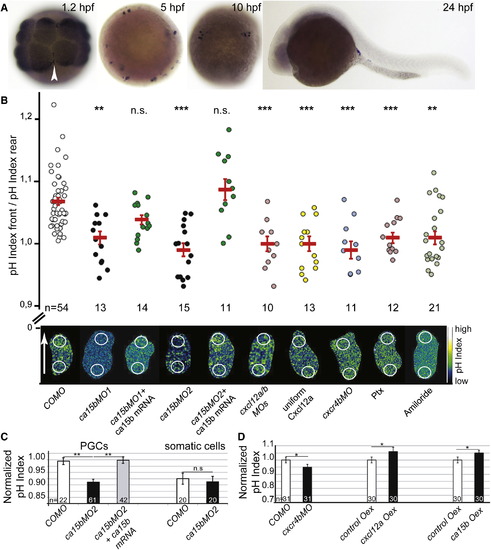
Ca15b and Cxcl12 Signaling Control the Polar pH Distribution in PGCs (A) Expression pattern of ca15b RNA in embryos at 1.2, 5, 10, and 24 hpf (blue staining). The arrowhead points at the position of the germplasm. (B) Polar pH distribution in PGCs depends on the function of Ca15b, on Cxcl12 chemokine gradient, on G protein signaling, and on Na+/H+ exchangers. The graph presents average pH index ratios between the front and the rear of migrating PGCs in 7–8 hpf embryos injected with the following: control morpholino (COMO), ca15b morpholino (ca15bMO1 and ca15bMO2), ca15b morpholino 1 and 2 along with morpholino-insensitive ca15b mRNA to restore Ca15b function, combined Cxcl12a and Cxcl12b morpholinos (cxcl12a/b MOs) for chemokine depletion, cxcl12a RNA for uniform Cxcl12a distribution, cxcr4b morpholino (cxcr4bMO), and Ptx RNA for disruption of the chemokine signaling pathway. Embryos were soaked in amiloride to interfere with the activity of Na+/H+ exchangers. Lower panel of images presents examples of PGCs with the corresponding treatments. Images were acquired using a confocal microscope. White circles depict areas at the front and back of PGCs used for pH index measurements. The white arrow indicates the direction of migration. (C) Graphs show average whole-cell pH index intensity values in PGCs and somatic cells at 6–7 hpf following knockdown and restoration of Ca15b activity (labeling as in B). (D) Graph presenting average global pH index levels in PGCs subjected to cxcr4b knockdown (cxcr4bMO) and Cxcl12a or Ca15b overexpression (Oex). n denotes the number of PGCs analyzed. p < 0.05, p < 0.01, p < 0.001 as determined by the Student’s t test. Error bars represent SEM. |
| Gene: | |
|---|---|
| Fish: | |
| Anatomical Terms: | |
| Stage Range: | 16-cell to Prim-5 |
| Fish: | |
|---|---|
| Condition: | |
| Knockdown Reagents: | |
| Observed In: | |
| Stage: | Shield |