
Fig. 3
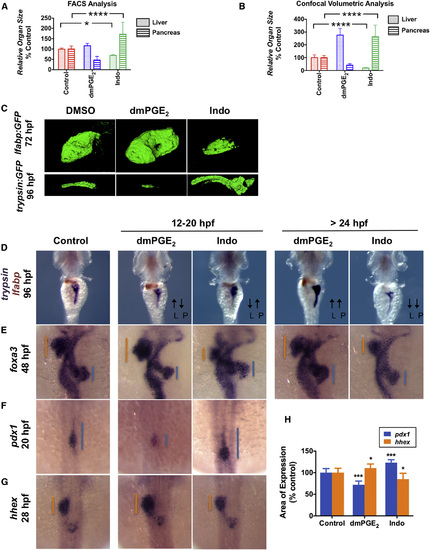
PGE2 Influences Liver versus Pancreas Specification (A) FACS quantification of liver and pancreas GFP+ cells in lfabp:GFP or elastase:GFP fish, respectively, at 96 hpf following exposure to dmPGE2 or Indo from 12 to 20 hpf. (Data are represented as mean ± SEM; significant across treatment groups, ANOVA, p < 0.0001, p < 0.05.) (B) Analysis of organ [volume] × [fluorescence intensity] of the liver or pancreas in lfabp:GFP fish at 72 hpf or trypsin:GFP fish at 96 hpf, respectively, visualized by confocal microscopy following treatment with dmPGE2 or Indo from 12 to 20 hpf. (Data are represented as mean ± SEM; significant across treatment groups, ANOVA, p < 0.0001; n = 5 per condition.) (C) Confocal microscopy of the liver at 72 hpf in lfabp:GFP fish or pancreas at 96 hpf in trypsin:GFP fish following exposure to dmPGE2 or Indo from 12 to 20 hpf. Volume and fluorescence intensity are quantified in (B). (D) Double in situ hybridization for trypsin (purple) + lfabp (brown) at 96 hpf reveals reciprocal effects on organ size following 12–20 hpf exposure to dmPGE2 or Indo. Dorsal view. L, liver; P, pancreas. (E) In situ hybridization for foxa3 at 48 hpf reveals reciprocal effects on the liver and pancreas buds emerging from the gut endoderm. The extent of the liver bud is indicated in orange and of the pancreas bud in blue. Dorsal view. (F and G) Early exposure to dmPGE2 or Indo results in a smaller (89.1% of embryos; n = 41/46) or larger (95.1% of embryos; n = 39/41) domain, respectively, of pancreas progenitor cells visualized by pdx1 at 20 hpf, and a larger (68.6% of embryos; n = 35/51) or smaller (72.7% of embryos; n = 32/44) domain, respectively, of liver progenitor cells marked by hhex at 28 hpf. Dorsal view. (H) Quantification of the area of pancreas progenitors or liver progenitors following exposure to dmPGE2 or Indo during somitogenesis, shown as % control. (Data are represented as mean ± SEM; significant across treatment groups, ANOVA, p < 0.001, p = 0.013; n = 5 per treatment group.) See also Fig. S3. |
| Genes: | |
|---|---|
| Fish: | |
| Conditions: | |
| Anatomical Terms: | |
| Stage Range: | 20-25 somites to Day 4 |
| Fish: | |
|---|---|
| Conditions: | |
| Observed In: | |
| Stage Range: | 20-25 somites to Day 4 |
Reprinted from Developmental Cell, 28(4), Nissim, S., Sherwood, R.I., Wucherpfennig, J., Saunders, D., Harris, J.M., Esain, V., Carroll, K.J., Frechette, G.M., Kim, A.J., Hwang, K.L., Cutting, C.C., Elledge, S., North, T.E., and Goessling, W., Prostaglandin E2 regulates liver versus pancreas cell-fate decisions and endodermal outgrowth, 423-437, Copyright (2014) with permission from Elsevier. Full text @ Dev. Cell