
Fig. 6
- ID
- ZDB-FIG-140327-2
- Publication
- Kumari et al., 2013 - An essential role for maternal control of Nodal signaling
- Other Figures
- All Figure Page
- Back to All Figure Page
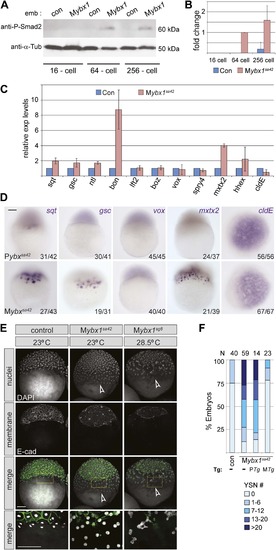
Nodal signaling is deregulated in Mybx1 embryos. (A) Phosphorylated-Smad2 is detected at the 64-cell stage in Mybx1 embryos. (B) Phospho-Smad2 levels are elevated in Mybx1 embryos at cleavage stages, compared to controls. (C) Quantitative real-time RT-PCR shows that Nodal target (sqt, gsc, ntl, bon) and YSL gene expression (mxtx2) is elevated in Mybx1 compared to controls, whereas expression of lefty2, the Wnt target, boz, ventral mesoderm gene vox, FGF target spry4, and the enveloping layer (EVL) marker cldE, is either not significantly altered or marginally reduced. (D) Whole mount in situ hybridization shows expanded YSL domains of sqt, gsc, and mxtx2 in Mybx1 embryos; the cldE expression domain is not significantly different from controls, and vox is not detectable. Scale bar, 100 µm. (E) Mybx1 mutants have expanded YSL. DAPI staining to detect nuclei and E-cadherin immunostaining to detect membranes shows 1 tier of YSL nuclei (undergoing division) in control embryos. In Mybx1sa42and Mybx1sg8 embryos, multiple tiers of YSL are observed (yellow boxed area). Bottom panels show higher magnification of yellow, boxed area. Cell membranes are clearly demarcated in control embryos, but appear fragmented in Mybx1 mutants. Scale bars, 100 µm. (F) Histogram showing YSL nuclei numbers in Mybx1 and control embryos, with or without ybx1 transgenes at 23°C. ~75% of control embryos have no YSL nuclei and only 25% show 1-6 YSL nuclei, whereas ~80% of Mybx1 embryos and Mybx1 embryos with PTg, show 7 or more YSL nuclei, and ~25% show >20 YSL nuclei. Mybx1 embryos with ybx1 MTg show reduced numbers of YSL nuclei. Number of embryos scored is indicated above the histogram. Error bars in B and C show standard deviation from three experiments. |
| Genes: | |
|---|---|
| Fish: | |
| Anatomical Terms: | |
| Stage: | 512-cell |
| Fish: | |
|---|---|
| Condition: | |
| Observed In: | |
| Stage Range: | 16-cell to 512-cell |