
Fig. 1
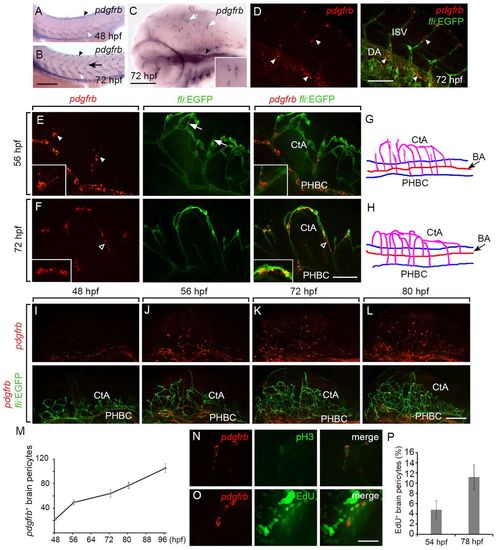
pdgfrb expression marks brain pericytes in zebrafish embryos and larvae. (A,B) pdgfrb expression detected by ISH in trunk vasculature. Black arrowheads, DLAV; white arrowheads, DA; arrow, ISV. (C) pdgfrb expression in head vessels. Black arrowhead, primary head sinus; white arrows, pdgfrb+ cells associated with central arteries. Inset shows a high magnification view of pdgfrb+ cells in the brain. (D) Fluorescence ISH showing pdgfrb expression in trunk vessels (arrowheads). (E,F) Confocal sections showing pdgfrb expression in the hindbrain vasculature at 56 and 72 hpf, respectively. Arrowheads, Y-shape cell body of a pdgfrb+ pericyte; arrows, sprouting endothelial tip cells; open arrowhead, spindle-like cell body of a pdgfrb+ pericyte. Insets show a high magnification view of the pdgfrb+ pericytes. (G,H) Diagrams depicting hindbrain vasculatures at 56 hpf (G) and 72 hpf (H). (I-L) Confocal projections showing pdgfrb+ pericytes in the entire brain at 48, 56, 72 and 80 hpf. (M) Quantification of pdgfrb+ brain pericytes at different time points during embryonic and larval development (48 hpf and 56 hpf, n=15 each; other time points, n=30 each). (N) pH3+ pdgfrb+ brain pericyte at 78 hpf. (O) EdU+ pdgfrb+ brain pericyte at 78 hpf. (P) Percentage of EdU+ brain pericytes labeled by a 1-hour pulse at 54 hpf and 78 hpf (n=15 each). Error bars represent s.d. BA, basal artery; CtA, central artery; DA, dorsal aorta; ISV, intersegmental vessels; PHBC, primary hindbrain channels. Scale bars: 0.5 mm (A,B); 250 µm (C); 200 μm (D-F,I-L); 40 μm (N,O). |
| Genes: | |
|---|---|
| Fish: | |
| Anatomical Terms: | |
| Stage Range: | Long-pec to Protruding-mouth |