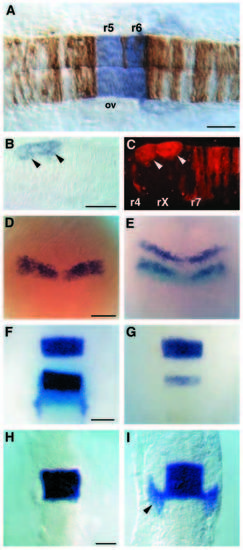
val expression during hindbrain segmentation. (A) val mRNA expression at the 18 somite stage (18 h; blue staining) corresponds to the domain in which val function is required as determined by genetic mosaic analysis in which valb337 cells (brown) were transplanted into the hindbrain region of a wild-type host embryo at the early gastrula stage (Moens et al., 1996). Dorsal view, with anterior to the left. ov: otic vesicle. (B,C) Transmitted and fluorescent images of a genetic mosaic embryo in which cells fom a wild-type embryo were transplanted into a valb337 host at the early gastrula stage. val expression (blue staining in B) is restricted to wild-type cells (marked by red fluorescence in C) that form abnormal clumps in rX of a valb337 host embryo (arrowheads). Dorsal view, anterior to the left. (D-I) val expression in wild-type and valb337 embryos in dorsal view with anterior to the top. (D) Earliest val expression is at bud stage (10 h) in a broad band in the neural plate. (E) Double in situ hybridization at the same stage showing krox-20 expression in the presumptive r3 and r5 (dark purple), and val expression (light blue) extending posterior to the r5-specific band of krox20. (F,G) Double in situs at the 10 somite stage (14 h) in wildtype (F) and valb337 (G) embryos, which can be distinguished by the near-absence of krox20 expression (dark purple) in r5 of valb337 embryos (Moens et al., 1996). val expression (light blue) corresponds to r5 and r6 in wild-type embryos (F) but no expression is observed in valb337 embryos (G). (H) val expression in a wild-type embryo at 10 somites is restricted to r5 and r6 but is not yet observed in neural crest cells migrating into the third pharyngeal arch (compare to krox20 expression in these cells at the same stage in F). (I) By the 14 somite stage (16 h) val expression is observed in r5 and r6 and in neural crest cells migrating into the third arch (arrowhead). Scale bars in A-C, F-H = 50 μm; D,E = 100 μm.
|
