|
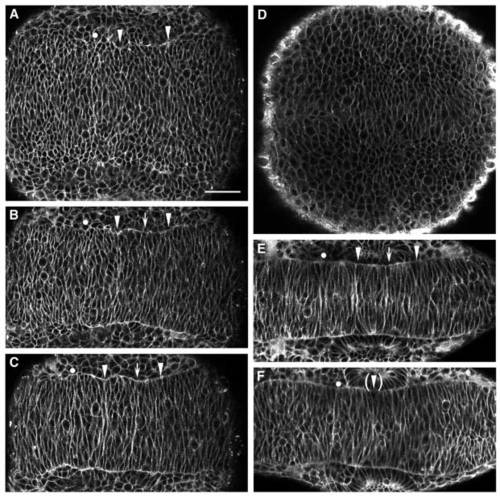
Time-lapse analysis of rhombomere boundary formation. (A-C) Confocal time-lapse images of a single BODIPY-stained embryo at approximately 6 somites (12 h; A), 8 somites (13 h; B) and 10 somites (14 h; C), in dorsal view with anterior to the right. During this interval, the r5/6 boundary becomes visible (arrow) between the r4/5 and r6/7 boundaries (arrowheads). (D) Bud-stage embryo (10 h), with no visible rhombomere boundaries. (E,F) Wild-type (E) and valb337 (F) embryos at 12 somites (15 h), demonstrating that the r5/6 boundary fails to form in valb337 embryos. An r4/rX boundary is initiated, although it is never morphologically visible (Moens et al., 1996). In all panels, the r3/4 boundary is marked by a dot, the r4/5 and r6/7 boundaries by arrowheads, and the r5/6 boundary by an arrow. Scale bars = 50 μm.
|