
Fig. 4
- ID
- ZDB-FIG-140219-25
- Publication
- Recher et al., 2013 - Zebrafish midbrain slow-amplifying progenitors exhibit high levels of transcripts for nucleotide and ribosome biogenesis
- Other Figures
- All Figure Page
- Back to All Figure Page
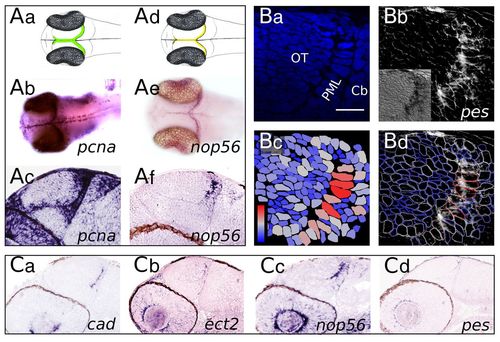
Transcript distribution in the midbrain: ‘large’ and ‘thin’ domains. (A) Whole-mount embryos (b,e) and parasagittal sections (c,f) following in situ hybridisation (ISH) with pcna (b,c) and nop56 (e,f) probes. pcna is expressed in a ‘large’ domain containing all proliferating cells. The nop56 expression domain is ‘thin’ and restricted to PML SAPs. (B) The pes ISH signal colocalises with PML cells (the largest midbrain cells). (a) Nuclear DAPI staining. (b) Inverted colour brightfield image of the same field showing the pes ISH signal. Inset shows the real colour brightfield image. (c) Colour-coded nuclei surface. On the blue-red scale, red corresponds to 22 μm2 and dark blue to 0 μm2. (d) Overlay of the inverted brightfield image with the nuclei border colour-coded drawing. Red nuclei exhibit a strong pes ISH signal. (C) Sagittal sections of embryos at 2 dpf. ISH long staining time emphasizes PML-specific gene expression. Scale bar: 10 μm. |
| Genes: | |
|---|---|
| Fish: | |
| Anatomical Term: | |
| Stage: | Long-pec |