
Fig. 2
- ID
- ZDB-FIG-140219-23
- Publication
- Recher et al., 2013 - Zebrafish midbrain slow-amplifying progenitors exhibit high levels of transcripts for nucleotide and ribosome biogenesis
- Other Figures
- All Figure Page
- Back to All Figure Page
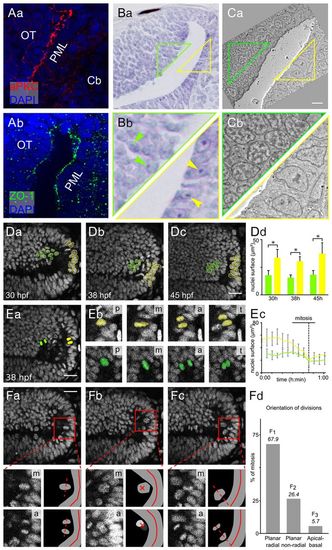
The PML is a neuroepithelial proliferation zone. (A) Sagittal sections at 48 hpf showing the expression of apical markers in PML cells: aPKC (a) and ZO-1 (b). Nuclei are stained with DAPI. (B) Nissl staining of sagittal sections showing that PML cells (yellow triangle) have larger nuclei with bigger nucleoli than OT cells (green triangle). Arrowheads indicate nucleoli. (C) Electron microscopy image of a sagittal section at 48 hpf showing that PML cells (yellow triangle) have decondensed chromatin, whereas chromatin in OT cells (green triangle) is condensed. (D) Sagittal optical sections of the OT from a Tg(Xla.Eef1a1:H2B-Venus) embryo. Interphase nuclei in the PML (yellow) are larger than at the margin of the OT (green). At all stages, the surface areas of the PML and the OT nuclei are significantly different (Mann-Whitney U-test, *P<0.001); error bars indicate s.d. (E) Average PML and OT nucleus size for ten mitoses. (a) Location of tracked nuclei (as detailed in b). p, prophase/prometaphase; m, metaphase; a, anaphase; t, telophase/cytokinesis. (c) M phase is indicated by a dotted line. OT, green; PML, yellow. (F) Mitosis orientations. (a) Planar radial division [30:56 (hours:minutes) hpf]. (b) Planar non-radial division (30:52 hpf). (c) Apicobasal division (31:13 hpf). (Bottom panels) Enlarged metaphase plate (labelled m), subsequent anaphase (labelled a) and corresponding interpretive diagrams. For planar non-radial divisions (b), the two daughter cells are not in the same plane. The anaphase image is the sum of the images centred on the two daughter cells. The red cross indicates the axes of the planar non-radial mitoses. Of 53 mitoses, 36 are planar radial, 14 are planar non-radial and 3 are apicobasal. (d) Non-random predominantly planar radial mitoses according to χ2 test (P<0.001). Cb, cerebellum; OT, optic tectum; PML, peripheral midbrain layer. Scale bars: 20 μm. |
| Genes: | |
|---|---|
| Antibodies: | |
| Fish: | |
| Anatomical Terms: | |
| Stage Range: | Prim-15 to Long-pec |