
Fig. S9
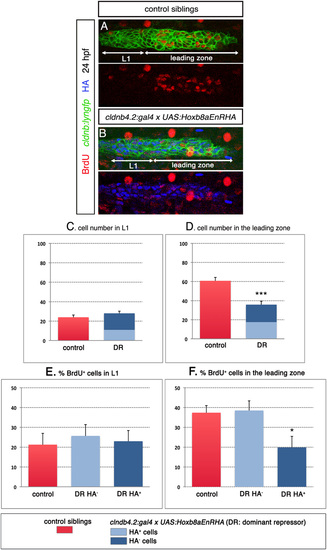
Overexpression of Hoxb8aEnRHA in the primordium decreases proliferation in a cell-autonomous manner. (A and B) BrdU (red) and HA (blue) double immunostaining in cldnb:lyngfp (green) and cldnb4.2:gal4 x UAS:Hoxb8aEnRHA embryos and control siblings at 24 hfp. Histograms of cell number in (C) L1 and (D) the leading zone of cldnb4.2:gal4 x UAS:Hoxb8aEnRHA embryos (n = 7) and control siblings (n = 7) at 24 hpf. For cldnb4.2:gal4 x UAS:Hoxb8aEnRHA primordia, dark and light blue boxes represent the numbers of HA positive and negative cells, respectively. Histograms showing the proportion of BrdU postitive cells in (E) L1 and (F) the leading zone of cldnb4.2:gal4 x UAS:Hoxb8aEnRHA (n = 7) and control siblings (n = 7) at 24 hpf. For cldnb4.2:gal4 x UAS: Hoxb8aEnRHA primordia, dark and light blue bars represent the proportion of BrdU positive cells among HA positive and negative cells, respectively. *P < 0.05; ***P < 0.001. |
| Fish: | |
|---|---|
| Observed In: | |
| Stage: | Prim-5 |