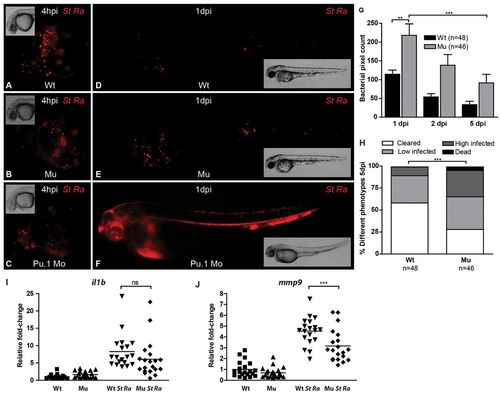
Bacterial burdens and qPCR analysis of gene expression in myd88-/- and wild-type embryos infected with the attenuated S. typhimurium Ra strain. (A-F) Representative stereo fluorescence images of infected embryos. At 28 hpf, embryos were infected by injection into the blood island using ~150 cfu of DsRed-labeled S. typhimurium Ra. Pu.1 morpholino-injected embryos (Pu.1 Mo; C,F), deficient in phagocytic leukocytes, were included for comparison with wild-type (Wt; A,D) and myd88-/- (Mu; B,E) embryos. Dispersal of infected leukocytes over the yolk sac at 4 hpi (A–C) and the progression of infection at 1 dpi (D–F) are shown. (G). Quantification of bacterial burden. Stereo fluorescence images of infected embryos at 1, 2 and 5 dpi were used for quantification of bacterial fluorescent pixels. Data are accumulated from two individual experiments. Significant differences were determined by one-way ANOVA with Tukey’s multiple comparison method as a post-hoc test. (H) Variation in phenotypes at 5 dpi. Embryos were categorized according to infection levels as cleared (no remaining bacterial fluorescent pixels or pixel count below 10), low infected (pixel count between 10 and 100), high infected (pixel count above 100) or dead. The distribution over categories was significantly different based on a contingency test. (I,J) qPCR analysis of pro-inflammatory genes. RNA samples from infected embryos (St Ra) and their controls were taken at 5 dpi to determine differences between myd88-/- (Mu) and wild-type (Wt) in the expression levels of il1b (I) and mmp9 (J). Each data point represents an individual embryo and lines indicate the mean relative expression level, with uninfected wild type set at 1. Statistical analysis performed by one-way ANOVA with Tukey’s multiple comparison method as a post-hoc test. The mean expression levels of both genes were lower in infected mutants than in infected wild types, but the difference for il1b was not significant whereas the difference for mmp9 was significant.**P<0.01, ***P<0.001; ns, not significant.
|
