|
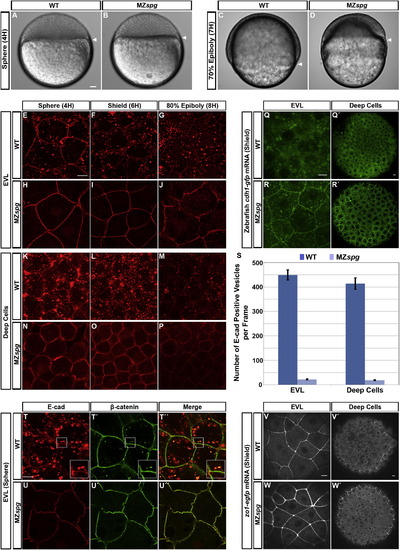
Pou5f1 Controls Subcellular Localization of E-cad(A–D) Live WT and MZspg embryos at sphere and 70% epiboly stages. Arrowheads indicate vegetal front of blastoderm. Lateral views, animal pole to the top. Scale bar, 50 μm.(E–P) Confocal images of anti-E-cad ECD immunofluorescence whole-mount embryos reveal E-cad subcellular localization in WT and MZspg embryos; stages as indicated.(Q–R′) Confocal images of GFP-tagged E-cad expressed from injected mRNA. Live embryos were imaged at shield stage.(S) Quantification of the number of E-cad-positive intracellular vesicles at shield stage (n = 26 embryos each for WT and MZspg. Error bars show SEM; p < 0.001).(T–U3) Coimmunofluorescence of E-cad (red) and β-catenin (green) in WT and MZspg embryos at sphere stage in fixed whole mounts. Insets in (T)–(T′′′) show higher magnification.(V–W′) Confocal images ZO-1-EGFP signal expressed from injected mRNA (shield stage).(E–R′) and (T–W′) Animal views. Scale bars, 10 μm. See also Figure S1 and Movie S1.
|