
Fig. 1
- ID
- ZDB-IMAGE-130412-16
- Antibodies
- Publication
- Song et al., 2013 - Pou5f1-dependent EGF expression controls e-cadherin endocytosis, cell adhesion, and zebrafish epiboly movements
- All Figures
- Figures for Song et al., 2013
|
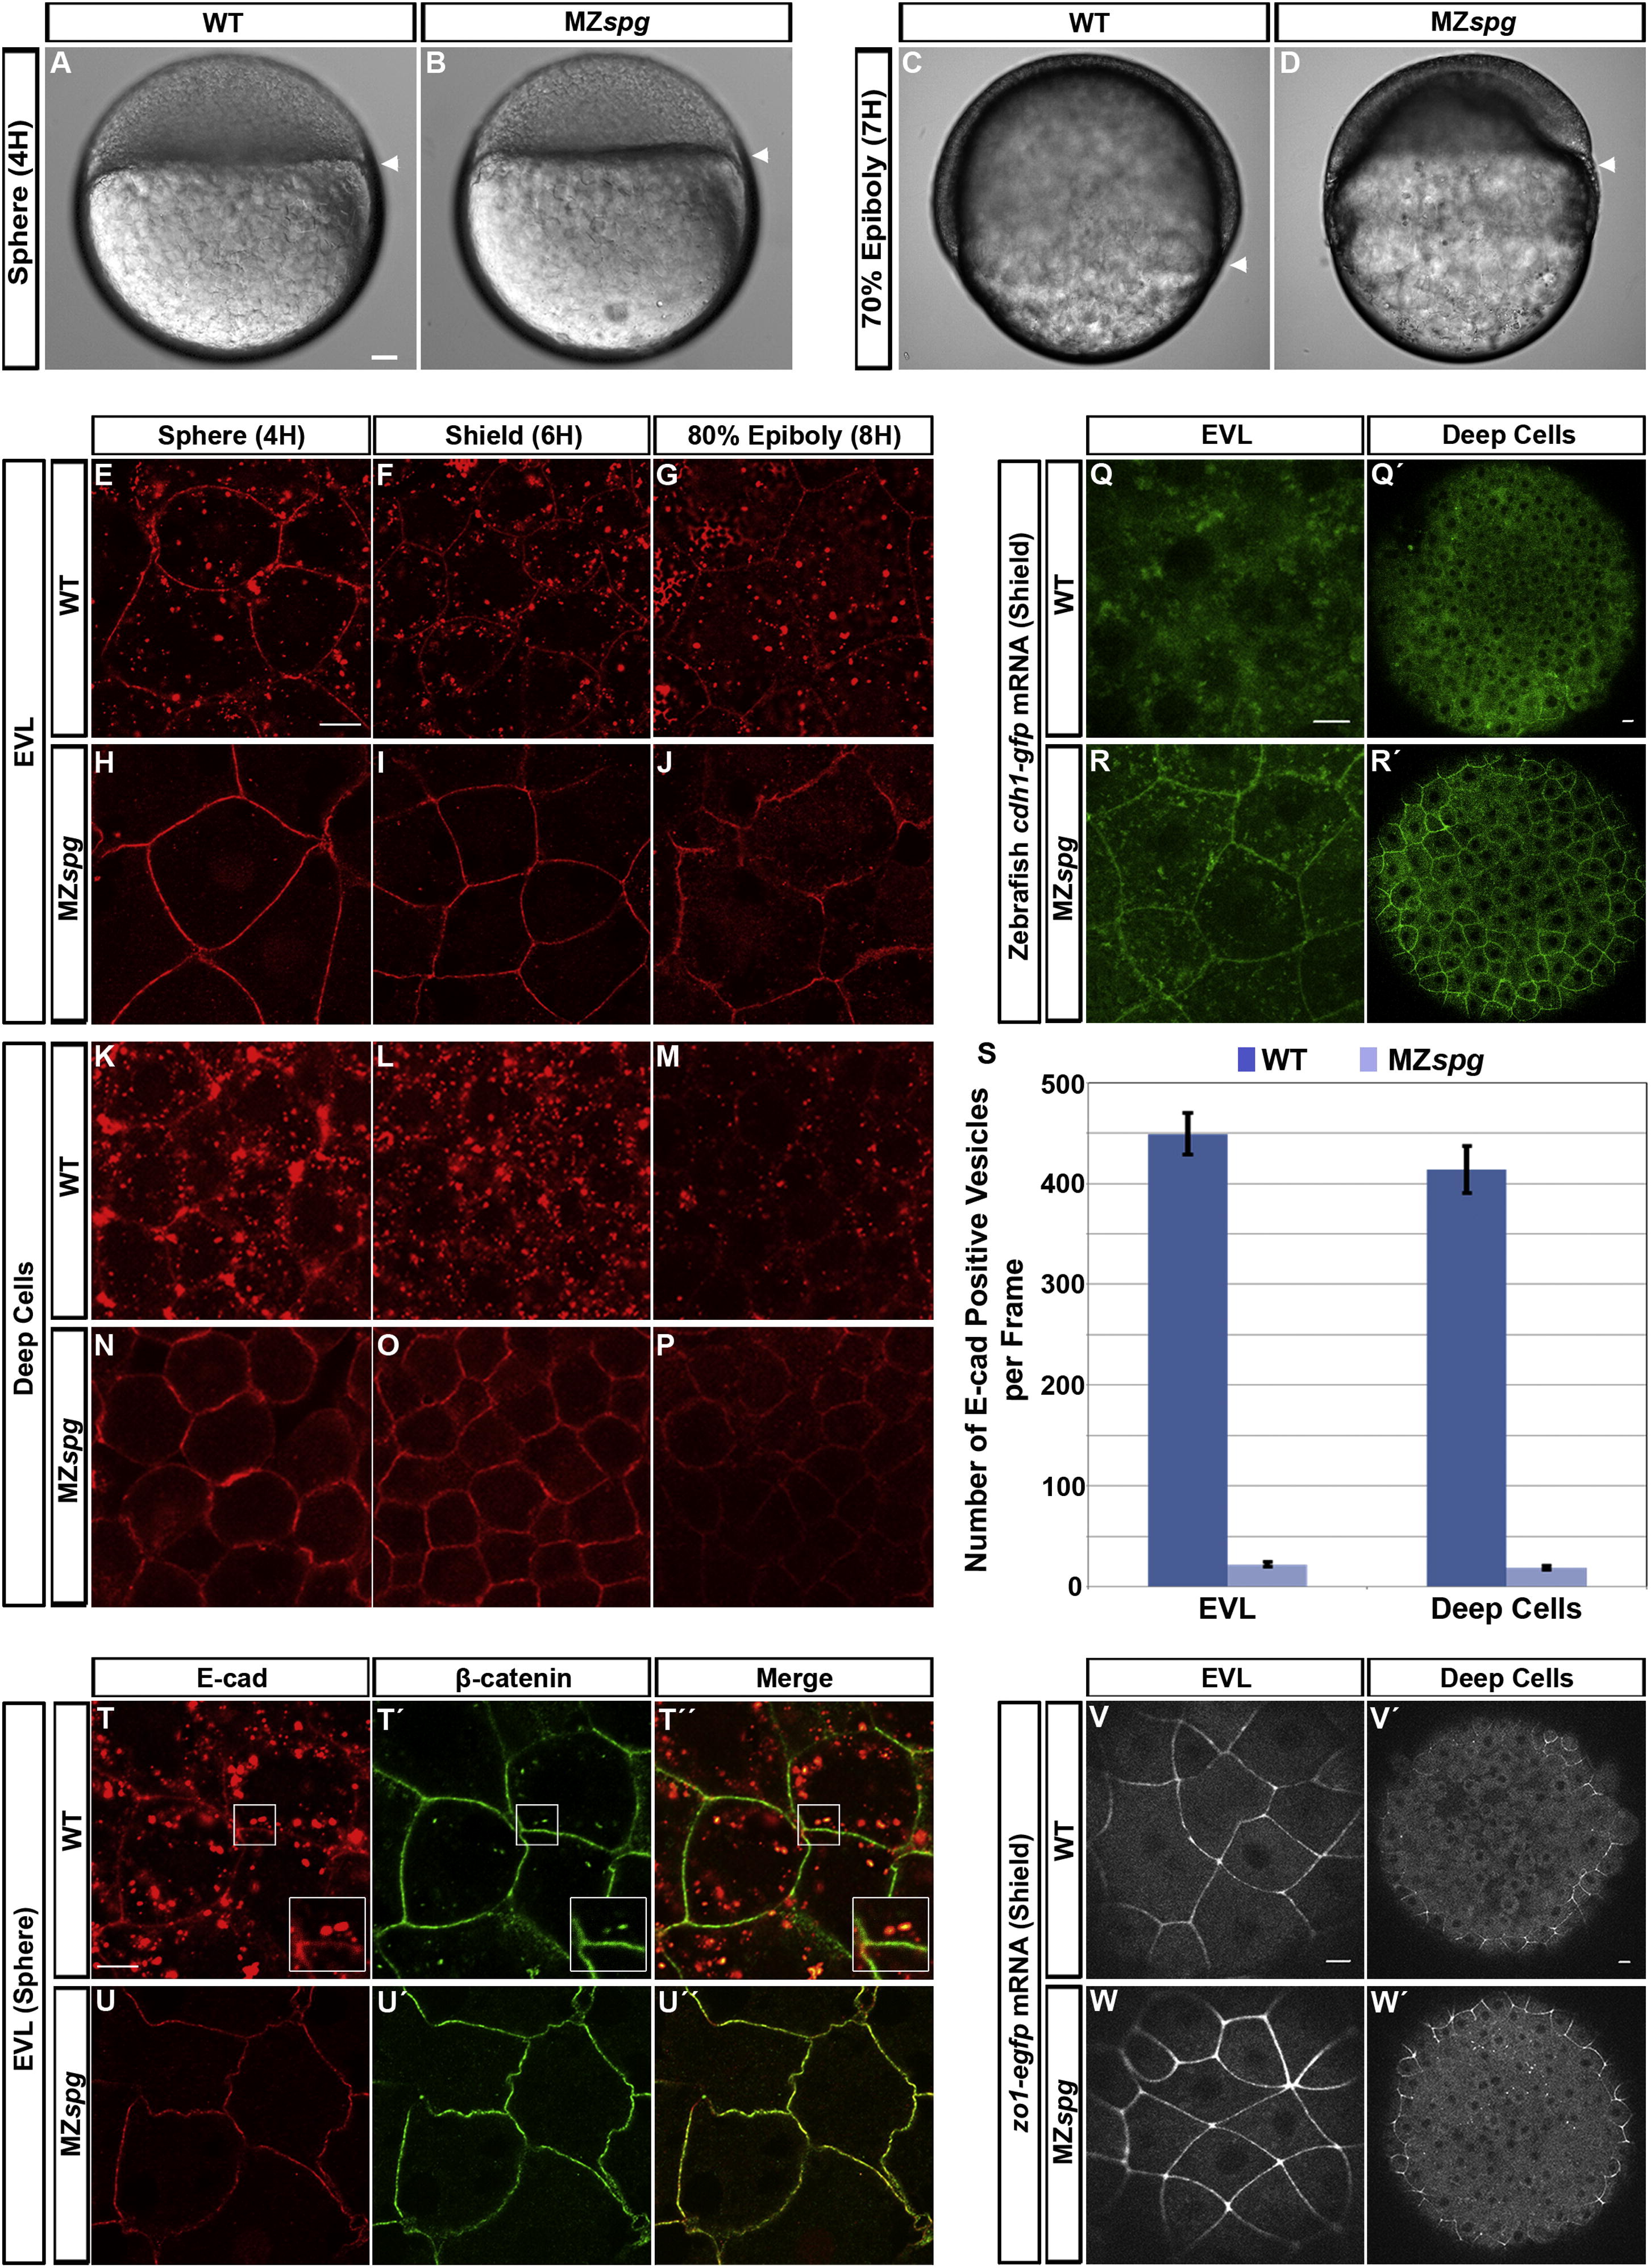
Fig. 1 Pou5f1 Controls Subcellular Localization of E-cad(A–D) Live WT and MZspg embryos at sphere and 70% epiboly stages. Arrowheads indicate vegetal front of blastoderm. Lateral views, animal pole to the top. Scale bar, 50 μm.(E–P) Confocal images of anti-E-cad ECD immunofluorescence whole-mount embryos reveal E-cad subcellular localization in WT and MZspg embryos; stages as indicated.(Q–R′) Confocal images of GFP-tagged E-cad expressed from injected mRNA. Live embryos were imaged at shield stage.(S) Quantification of the number of E-cad-positive intracellular vesicles at shield stage (n = 26 embryos each for WT and MZspg. Error bars show SEM; p < 0.001).(T–U3) Coimmunofluorescence of E-cad (red) and β-catenin (green) in WT and MZspg embryos at sphere stage in fixed whole mounts. Insets in (T)–(T′′′) show higher magnification.(V–W′) Confocal images ZO-1-EGFP signal expressed from injected mRNA (shield stage).(E–R′) and (T–W′) Animal views. Scale bars, 10 μm. See also Figure S1 and Movie S1.
Reprinted from Developmental Cell, 24(5), Song, S., Eckerle, S., Onichtchouk, D., Marrs, J.A., Nitschke, R., and Driever, W., Pou5f1-dependent EGF expression controls e-cadherin endocytosis, cell adhesion, and zebrafish epiboly movements, 486-501, Copyright (2013) with permission from Elsevier. Full text @ Dev. Cell