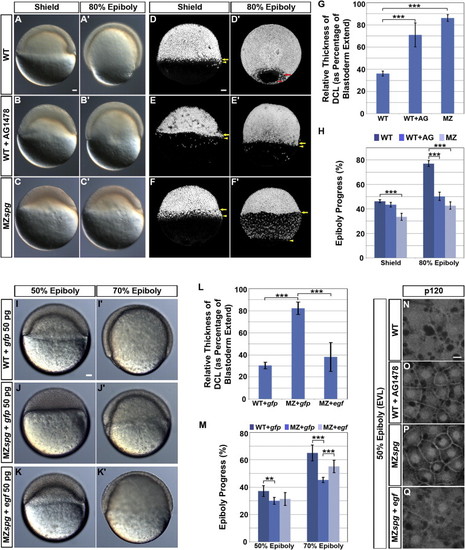
EGF Signaling Controls DCL Thinning and Epiboly Progression (A–F′) Phenotypes of WT, EGFR inhibitor AG1478-treated WT, and MZspg embryos at shield stage and 80% epiboly. (A–C′) Images of live embryos. (D–F′) Confocal z-projection of cell nuclei stained with Sytox green in fixed embryos. Lateral views, animal pole to the top. Scale bars, 50 μm.(G and H) Quantification of relative DCL thickness at shield and epiboly progress at shield and 80% epiboly stages following EGFR inhibition (p < 0.001; n = 12 embryos each; error bars show SEM). (I–K′) Live epiboly phenotypes of control gfp mRNA-injected WT (I and I′), gfp mRNA-injected MZspg (J and J′), and egf mRNA-injected MZspg embryos (K and K′). Lateral views, animal pole to the top. Scale bar, 50 μm. (L and M) Quantification of DCL thickness at 50% epiboly and epiboly progress at 50% epiboly and 70% epiboly stages following egf mRNA injection (error bars show SEM; p < 0.01, p < 0.001; n = 12 embryos each).(N–Q) Confocal images of anti-p120 whole-mount immunofluorescence at 50% epiboly, conditions as indicated. Animal views. Scale bar, 10 μm.See also Figure S4 and Movie S3.
|
