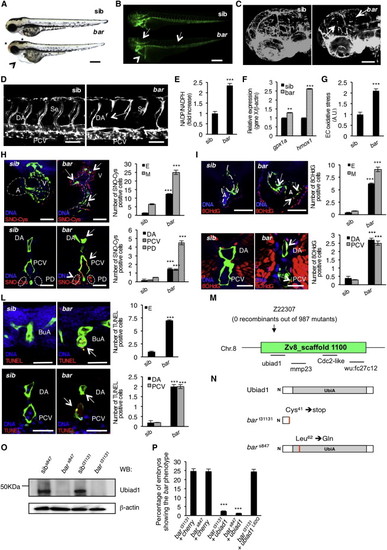
Loss of Ubiad1 Induces Cardiovascular Failure in Zebrafish Embryos by Increasing Oxidative Stress(A and B) Siblings (sib) and barolot31131 (bar) mutant embryos at 65 hpf. (A) Vascular hemorrhages (asterisks) and heart failure (arrowhead) in bar. (B) Tg(kdrl:GFP)s843bar show vascular integrity defects (arrows) and collapsed endocardium (arrowhead). Scale bar, 300 µm.(C) Tg(Fli1a:GFP)y1bar show severe loss of cranial network vasculature and fragmented endothelium (arrow) at 65 hpf.(D) Confocal images of trunk vasculature of Tg(kdrl:GFP)s843bar report loss of ECs at the level of Se, DA (arrows), and PCV. Scale bar, 50 µm.(E) NADP+/NADPH ratio at 60 hpf. Increased ratio is indicative of oxidative stress state.(F) Real-time PCR analysis show upregulation of the antioxidant genes glutathione peroxidase1a (gpx1a) and heme-oxigenase1 (hmox1) in bar at 56 hpf. Data are means ± SD.(G) Quantification of oxidative stress level in ECs derived from Tg(kdrl:GFP)s843 embryos at 56 hpf.(H) Immunofluorescence analyses for S-nitroso-cysteine (SNO-Cys, red) and DNA (blue) in Tg(kdrl:GFP)s843bar and sib embryos at 60 hpf. Upper left: heart transverse sections; upper right: quantification of SNO-Cys positive cells. Lower left: trunk vasculature transverse sections; lower right: quantification of SNO-Cys positive cells. Scale bar, 75 µm. Specific SNO-Cys signals were also detectable in pronephros and myocardium of bar (arrowhead).(I) Immunofluorescence analyses for 8-hydroxy-22deoxyguanosine (8OHdG, red) and DNA (blue) in Tg(kdrl:GFP)s843bar and sib at 56 hpf. Upper left: heart transverse sections; upper right: quantification of 8OHdG positive cells. Scale bars, 50 µm. Lower left: trunk vasculature transverse sections; lower right; quantification of 8OHdG positive. Scale bar, 20 µm. bar show specific 8OHdG staining in endocardial and endothelial cells (arrows) and myocardium (arrowhead).(L) TUNEL-positive (red) cells show apoptosis in endocardium and endothelium (arrows). Upper left: heart transverse sections of Tg(kdrl:GFP)s843bars847 and sib; upper right: quantification of TUNEL-positive cells. Lower left: transverse sections of trunk vasculature; lower right: quantification of positive cells in DA and PCV. Scale bars, 20 µm.(M) Genetic map of the zebrafish barolo locus. The SSLP markers (z22307) was used to identify the “zero recombinant” region by analysis of 987 diploid mutants.(N) Schematic representation of zebrafish Ubiad1. UbiA:UbiA domain.(O) Western blot analysis of protein extracts from bars847 and bart31131 and respective siblings at 72 hpf.(P) Embryos from bars847 and bart31131 heterozygote intercrosses were injected with mRNA encoding for wild-type ubiad1 mRNA, ubiad1L62Q or fluorescent protein cherry (ctrl). bars847 as well as bart31131 were not rescued by microinjection of ubiad1L62Q mRNA.A, atrium; V, ventricle; DA, dorsal aorta; PCV, posterior cardinal vein; BuA bulbus arteriosus; PD, pronephric ducts; E, endocardium; M myocardium. All data are means ± SEM. p < 0.01, p < 0.001.See also S1, Table S1, and Movies S1, S2, S3, and S4.
|
