
Fig. S3
- ID
- ZDB-FIG-130322-16
- Publication
- Choi et al., 2013 - In vivo monitoring of cardiomyocyte proliferation to identify chemical modifiers of heart regeneration
- Other Figures
- All Figure Page
- Back to All Figure Page
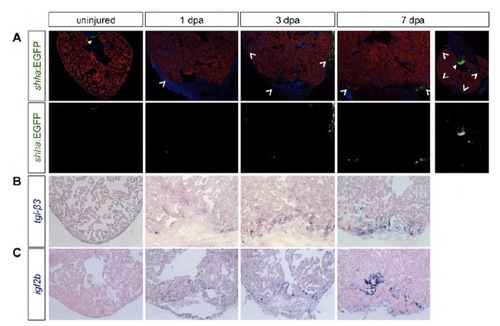
Complete time course panel of ligand expression. (A) shha regulatory sequences drive EGFP in the valves of uninjured hearts, and is upregulated in patchy areas (arrowheads) of the epicardium at 1 and 3 dpa. By 7 dpa, expression is detected in epicardial cells within the injury, as well as more globally in the epicardium surrounding the heart. Top: shh:EGFP, green; Myosin heavy chain, red; DAPI, blue; notched arrowheads, shh:EGFP expression; filled arrowheads, valve expression. Bottom: shh:EGFP expression. (B) tgfb3 expression is detectable at low levels in the myocardium by 1 and 3 dpa and localizes to the injury site by 7 dpa. (C) After injury, the ligand igf2b is expressed in endocardial cells, and at lower levels in epicardial tissue, near the injury site. |