
Fig. S3
- ID
- ZDB-IMAGE-130322-2
- Publication
- Choi et al., 2013 - In vivo monitoring of cardiomyocyte proliferation to identify chemical modifiers of heart regeneration
- All Figures
- Figures for Choi et al., 2013
|
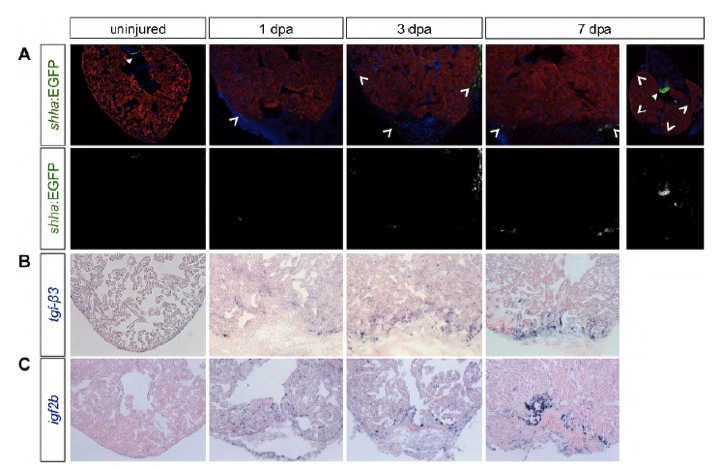
Fig. S3 Complete time course panel of ligand expression. (A) shha regulatory sequences drive EGFP in the valves of uninjured hearts, and is upregulated in patchy areas (arrowheads) of the epicardium at 1 and 3 dpa. By 7 dpa, expression is detected in epicardial cells within the injury, as well as more globally in the epicardium surrounding the heart. Top: shh:EGFP, green; Myosin heavy chain, red; DAPI, blue; notched arrowheads, shh:EGFP expression; filled arrowheads, valve expression. Bottom: shh:EGFP expression. (B) tgfb3 expression is detectable at low levels in the myocardium by 1 and 3 dpa and localizes to the injury site by 7 dpa. (C) After injury, the ligand igf2b is expressed in endocardial cells, and at lower levels in epicardial tissue, near the injury site.