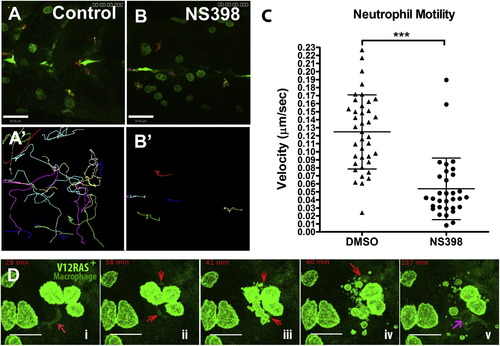
Live Imaging Reveals that Reduced PGE2 Levels as a Result of COX-2 Inhibition Lead to Leukocyte Behavior Change and Increased Transformed-Cell Death(A and B) Still images from movies illustrating neutrophil (red) numbers and their motility in the vicinity of V12RAS transformed cells (green) in (A) control and (B) NS398-treated larvae (images are taken from Movie S1) (A′ and B′) show the tracks over 100 min of neutrophil movements from the two movies S1A and S1B, respectively, revealing reduced neutrophil motility in NS398-treated (B2) compared with control (A′) larva. Scale bars represent 50 μm.(C) Quantification of neutrophil migration velocity (V = mean ± SD); DMSO-treated V = 0.125 ± 0.046 μm (n = 39); NS398-treated V = 0.054 ± 0.038 μm (n = 32).(D) A series of still images from a time-lapse movie (see Movie S2) showing transformed-cell death associated with a macrophage encounter in a larva treated with NS398; subsequently, this macrophage and others engulf the resulting cell debris. Red arrows in (i)–(iv) indicate a macrophage labeled by NFκB-RE:eGFP (pale green). Purple arrow in (v) indicates a macrophage engulfing the transformed-cell debris and forming a phagosome inside its cell body. The scale bar represents 15 μm.
|
