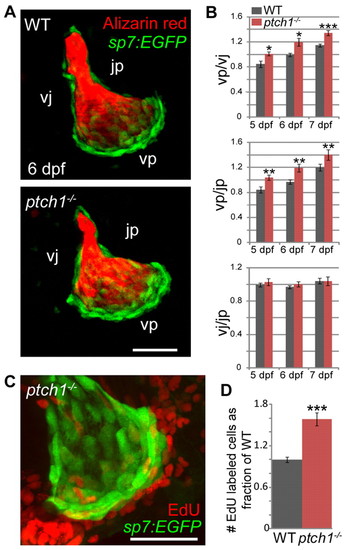
ptch1 represses bone growth and proliferation. Quantitation of Op edge lengths and cell proliferation in ptch1 mutants. Images are lateral views with dorsal upwards and anterior towards the left. (A) Confocal projections of ptch1 mutants and wild-type siblings carrying the sp7:EGFP transgene at 6 dpf demonstrate an apparent elongation of the vp edge in ptch1 mutants. (B) vp/jp and vp/vj ratios are significantly greater in ptch1 mutants relative to wild-type siblings. Conversely, the vj/jp ratio is unaffected in ptch1 mutants. (C,D) ptch1 mutants display a significant increase in EdU-positive cells within two cell diameters of the vp edge at 5 dpf (compare with wild type in Fig. 4 as number of proliferating cells in wild-type larvae was similar between the two experiments). Note that neuromast cells that are occasionally apparent near the v apex were not included in the count. Data are presented as mean±s.e.m., *P<0.05, **P<0.01, ***P<0.001 by unpaired t-test, ne7 per genotype/age. v, ventral apex; p, posterior apex; j, joint apex; vp, edge connecting v and p; vj, edge connecting v and j; jp, edge connecting j and p. Scale bars: 50 μm.
|
