
Fig. 5
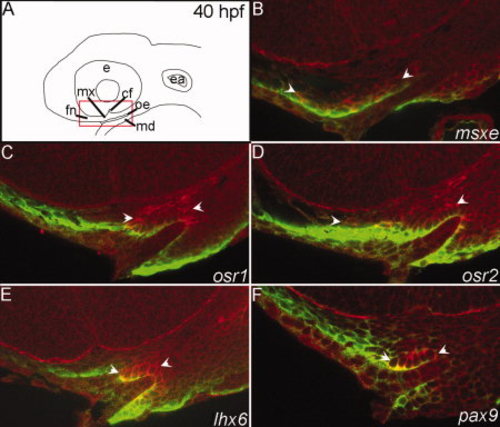
Fluorescent in situ hybridization optical sections verify the expression patterns of select transcription factors at 40 hours postfertilization (hpf). A: Schematic diagrams of a lateral view of the zebrafish head at 40 hpf, red box indicates the magnified view of the in situ sagittal sections. B–F: mRNA localization detected by fluorescence of the NBT/BCIP precipitate (red) and anti-enhanced green fluorescent protein (EGFP) immunostaining labels cranial neural crest cells (CNCC) in the fli1:EGFP transgenic background (green). Arrowheads indicate areas of CNCC expression domains. B:msxe is expressed in frontonasal and maxillary CNCC. C:osr1 is expressed in maxillary CNCC. D:osr2 is expressed in the frontonasal and maxillary CNCC. E: Maxillary CNCC express lhx6. F: The posterior maxillary CNCC express pax9. e, eye; mx, maxillary domain; md, mandibular domain; fn, frontonasal CNCC; cf, choroid fissure; oe, oral ectoderm; ea, ear. |
| Genes: | |
|---|---|
| Fish: | |
| Anatomical Terms: | |
| Stage: | Prim-25 |