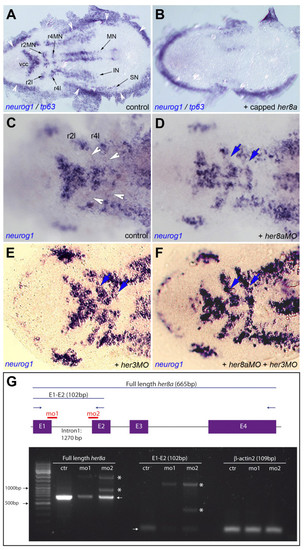
Like Her3, Her8a activity maintains the non-neurogenic areas of rhombomeres 2 and 4. A,B. neurog1 expression highlights the proneural clusters at the 3-somite stage (black arrows in A) and is eliminated upon her8a overexpression (B, embryo injected with her8a capped mRNA). Expression of tp63, which highlights the neural plate border (white arrowheads in A), is unchanged. C-F. Compared expression of neurog1 in control embryos (C) and embryos injected with her8aMO (D), her3MO (E) or both MOs (F) shows ectopic neurogenesis between the medial and lateral proneural clusters of r2 and r4 (blue arrows in D-F, compare with white arrowheads in C) when Her8a and/or Her3 activities are blocked. Few "ectopic" neurog1-positive can sometimes be found between the vcc and mnr2; this is however highly variable between individuals and observed in both control and morphant embryos. A-F are dorsal views of flat-mounted embryos, anterior left. Abbreviations: black arrows indicate proneural clusters: IN: presumptive interneurons, MN: presumptive motoneurons, r2: rhombomere 2, r4: rhombomere 4, r2l: lateral neurons of rhombomere 2, r4l: lateral neurons of rhombomere 4, SN: presumptive sensory neurons, vcc: ventro-caudal cluster. G. RT-PCR analysis of her8a expression (left and middle panels) in embryos injected with her8aMO1 ("mo1") and her8aMO2 ("mo2") versus control embryos ("ctr"). Low levels of full length, normally spliced her8a transcripts are detectable in morphants (left and middle panels, arrows) while abnormally spliced transcripts including all or part of intron 1 become produced (stars). Expression of βactin2, used as RT-PCR control, is indentical in all samples (right panel). The scheme at the top indicates the genomic structure of her8a, the position of exons (E, purple) and introns (black bars), the binding sites of her8aMO1 and MO2 (red), the position of RT-PCR primers (blue arrows) and the length of amplified wild-type products (excluding introns) (blue bars).
|

