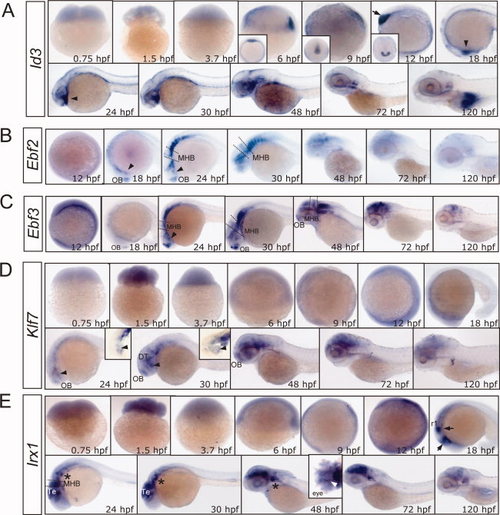
The expression profiles of a set of transcription factors in zebrafish larvae revealed by in situ hybridization. A: Id3 hybridization signals are detected from the two-cell stage. At later stages, Id3 expression is enriched in the diencephalon. An arrow indicates the polster, and arrowheads indicate the PT. Inserts are the dorsal view. B,C: Ebf2 and Ebf3 are highly expressed in the PT area of the diencephalon, MHB, OB, and HB. Arrowheads indicate the PT area of diencephalon. Dashed lines indicate the mid–hindbrain boundary. D: The expression of Klf7 is detected in the diencephalon, OB, DT, and HB. Inserts are lateral view of embryos with yolk sac and eyes removed. Arrowheads indicate the PT. E: Irx1 is specifically expressed in the midbrain and rhombomere 1 at 18 hours postfertilization (hpf). Dense signals were also detected at the Te, MHB, and kidney from 24 hpf. Arrows indicate the midbrain and the first rhombomere (r1). The insert is the dorsal view of the embryo. An arrowhead (in white) in the insert indicates the diencephalon. An asterisk indicates the kidney. DT, dorsal thalamus; HB, hindbrain; MHB, mid–hindbrain boundary; OB, olfactory bulb; PT, posterior tuberculum; Te, tectum.
|
