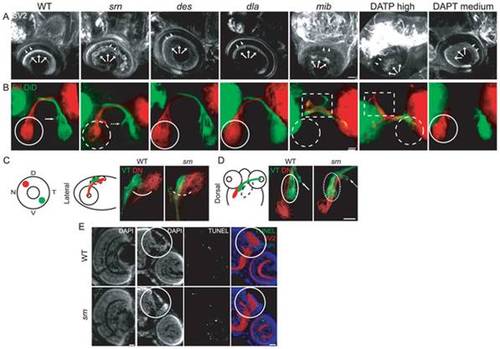
A. In srn mutants at 72 hpf, the OPL (arrowheads) and IPL (arrows) are disorganized; this is not seen in des or dla mutants. In mib mutants, retinal ganglion and other cells die, resulting in decreased retina neuropil (rightmost panel; 8 embryos, 2 carrier pairs for each). Scale bar = 20 μm. B. In srn mutants, retinal ganglion cell axons grow out to the optic chiasm and to optic tectum, but axon branches are aberrantly distributed within tectum (dashed white circle) and medial axon projections are shifted towards the midline (compare solid arrow and dashed arrow). Virtually all retina was dye labeled, and the labeling pattern was consistent across experiments, thus these defecs aren′t due to incomplete dye uptake or labeling in srn mutants. These phenotypes are not present in des or dla mutants, and are also different from mib mutants, in which retinal ganglion cell axonal projections to optic tectum are dramatically reduced, as a consequence of retinal ganglion cell death. Mib mutants also displayed axon pathfinding errors at the optic chiasm; axons branched anterior to the optic chiasm (dashed square), while branching within tectum was dramatically reduced (dashed white circle; 15 embryos, 3 carrier pairs for each). Scale bar = 20 μm. C, D. Topographic mapping of axon projections to optic tectum; dorsonasal (DN) and ventrotemporal (VT) axons were with DiI or DiD. DN and VT axon projections within tectum are aberrant in srn mutants, as is overlap dorsally (C) and laterally (D; 8 embryos, 2 carrier pairs for each). Scale bar = 20 μm. E. In retina and optic tectum (white circle), the overall cellular lamination pattern as assessed by DAPI staining is grossly normal in srn mutants (compare bottom left panels, WT and srn). TUNEL staining showed that increased cell death was observed in the retina of srn mutants compared to WT embryos at 72 hpf; no difference in cell death in the optic tectum was observed in srn mutants compared to WT embryos at 72 hpf (color overlay, right most panels; 2–3 embryos, 1 carrier pair). Scale bar = 20 μm.
|
