
Fig. 5
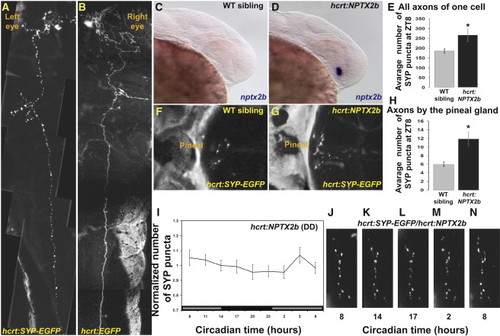
Arrhythmic Overexpression of nptx2b Increases Synaptic Density and Abolishes Synaptic Rhythms in HCRT Axons (A and B) Dorsal views, head to the left, of 4 dpf larvae transiently expressing either hcrt:SYP-EGFP (A) or hcrt:EGFP (B) transgenes. Pictures were cropped in the animal midline and juxtaposed to mirror each other for comparison. Transient expression of the SYP-EGFP presynaptic fusion protein is used to tag and quantify punctum number in all axons of single HCRT neurons (compare SYP-EGFP in A versus cytosolic EGFP in B). (C and D) Lateral views, head to the right, of 30 hpf wild-type (C) and transgenic embryos overexpressing nptx2b (hcrt:NPTX2b, D). hcrt:NPTX2b larvae (D) display strong nptx2b ISH staining, prior to the appearance of endogenous nptx2b expression in their wild-type siblings (C). (E) hcrt:SYP-EGFP transgene was injected into hcrt-NPTX2b and WT sibling embryos. Larvae 4 dpf that express EGFP in a single HCRT neuron (as shown in A) were selected. Overexpression of nptx2b in HCRT neurons increases total synapse numbers in all axons of a single HCRT neuron. (F–H) The number of puncta present on HCRT axons projecting to the pineal gland were quantified in control hcrt:SYP-EGFP (F) and hcrt:NPTX2b/hcrt:SYP-EGFP double-transgenic (G) 7 dpf fish at ZT8 (H). (I) Quantification of SYP-EGFP punctum number under DD (n = 11, gray bars represent subjective day) across 24 hr in hcrt:NPTX2b larvae. (J–N) Time-lapse imaging of HCRT axons located near the pineal gland in representative hcrt:SYP-EGFP/hcrt:NPTX2b double-transgenic individual. Note the absence of rhythmic variation. Statistical comparisons were performed with ANOVA and Student′s t tests. Each value represents mean ± SEM. |
| Gene: | |
|---|---|
| Fish: | |
| Anatomical Term: | |
| Stage: | Prim-15 |
| Fish: | |
|---|---|
| Observed In: | |
| Stage Range: | Prim-15 to Days 7-13 |