
Fig. 2
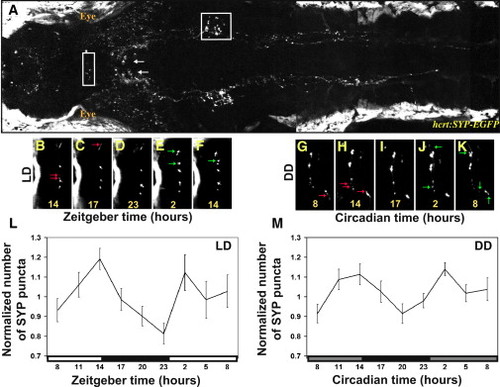
Real-Time In Vivo Analysis of Rhythmic Synaptic Density in HCRT Axons (A) Two-photon imaging of a 7 dpf stable transgenic hcrt:SYP-EGFP larva (dorsal view with head to the left). White arrows indicate HCRT cell bodies, and areas within the white frames in the midbrain and in the hindbrain are presented at higher magnification in (B)–(K) and Figure S2, respectively. (B–K) Time-lapse imaging of HCRT axons located by the pineal gland (close-ups of the white box area shown in B) in two representative hcrt:SYP-EGFP individuals (B–F under 14 light:10 dark [LD] and G–K under constant dark conditions [DD]). Examples of lost and new puncta are marked with red and green arrows, respectively. (L and M) Quantification of SYP-EGFP punctum number under LD (L, n = 12, LD represented by white and black bars) and DD (M, n = 9, gray bars represent subjective day) across 24 hr are presented. Numbers of puncta are rhythmic under both LD (p < 0.01) and DD (p < 0.01) conditions, with higher levels during the daytime. In each individual, punctum number was normalized at each time point to the mean value across the entire experiment. Repeated-measures ANOVA indicated a significant effect of time on these parameters. Each value represents normalized mean ± SEM. |
| Gene: | |
|---|---|
| Fish: | |
| Anatomical Terms: | |
| Stage: | Days 7-13 |