
Fig. 3
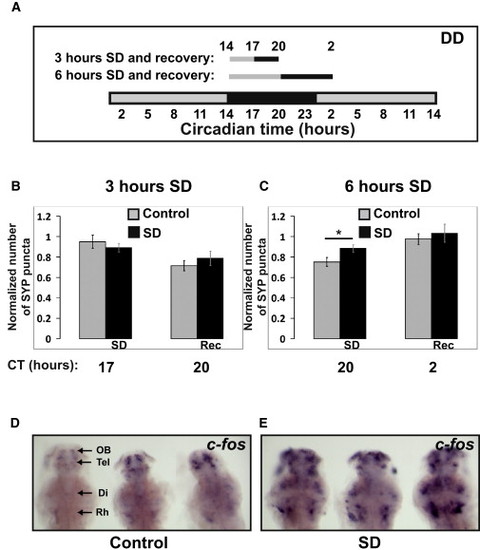
Punctum Number in HCRT Axons Increases after 6 hr of Sleep Deprivation (A–C) A schematic illustration of the SD experiments (A). Seven dpf larvae were sleep deprived for 3 (B) or 6 (C) hours at the beginning of the night (CT14). SYP-EGFP punctum number were quantified before SD (CT14 in B and C), immediately after SD (CT17 in B or CT20 in C), and after recovery (CT20 in B or CT2 in C). All experiments were performed under dark conditions (DD) and in living larvae. The number of puncta at each time point was normalized to the number recorded at the first time point (CT14) within the same individual. In all cases, with or without SD, punctum number was lower at night (see also Figure S3). Six but not three hours of SD significantly (*p < 0.05) increased the number of puncta. Statistical comparisons were performed with t tests and ANOVAs. Each value represents mean ± SEM. (D and E) Brain activity and wake is indicated by expression of c-fos mRNA in the brains of control (D) and sleep-deprived (E) larvae. All images are dorsal, with heads pointing to the top (three in each image). The following abbreviations are used: OB, olfactory bulb; Tel, telencephalon; Di, diencephalon; and Rh rhombencephalon. Similar results were obtained after 3 and 6 hr of SD. Note the efficiency of the SD procedure (D versus E). All sleep-deprived fish showed strong increases in expression. |
| Gene: | |
|---|---|
| Fish: | |
| Anatomical Term: | |
| Stage: | Days 7-13 |