
FIGURE
Fig. 3
- ID
- ZDB-FIG-100706-23
- Publication
- Takada et al., 2010 - Identification of genes expressed by zebrafish oligodendrocytes using a differential microarray screen
- Other Figures
- All Figure Page
- Back to All Figure Page
Fig. 3
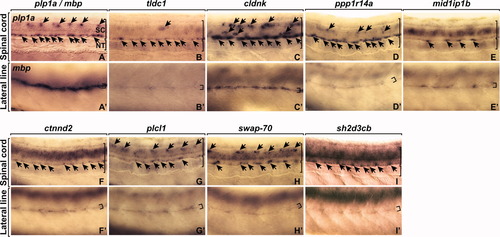
RNA expression patterns of genes in spinal cord and lateral line at 4 dpf. plpa1 and mbp expression marks differentiated oligodendrocytes and Schwann cells. A-I′: Panels show lateral views of spinal cord (A-I) and lateral line (A′-I′). Arrows in A-I indicate expression in oligodendrocytes. Small brackets in A′-I′ indicate lateral line nerve. SC, spinal cord; NT, notochord. |
Expression Data
| Genes: | |
|---|---|
| Fish: | |
| Anatomical Terms: | |
| Stage: | Day 4 |
Expression Detail
Antibody Labeling
Phenotype Data
Phenotype Detail
Acknowledgments
This image is the copyrighted work of the attributed author or publisher, and
ZFIN has permission only to display this image to its users.
Additional permissions should be obtained from the applicable author or publisher of the image.
Full text @ Dev. Dyn.