
FIGURE
Fig. 2
- ID
- ZDB-FIG-100706-22
- Publication
- Takada et al., 2010 - Identification of genes expressed by zebrafish oligodendrocytes using a differential microarray screen
- Other Figures
- All Figure Page
- Back to All Figure Page
Fig. 2
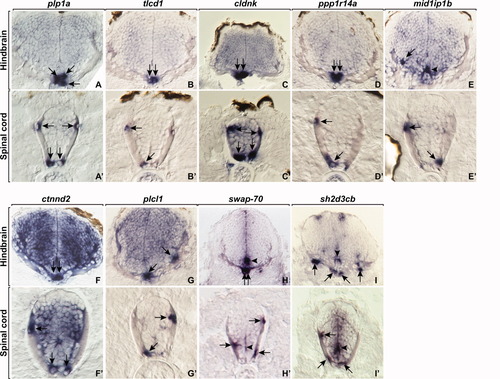
RNA expression patterns of genes in hindbrain and spinal cord at 4 days postfertilization (dpf). plp1a expression marks differentiating oligodendrocytes. A-I′: Panels show transverse sections of hind brain (A-I) and spinal cord (A′-I′). Arrows indicate expression in oligodendrocytes and arrowheads indicate expression in precursors near the central canal. |
Expression Data
| Genes: | |
|---|---|
| Fish: | |
| Anatomical Terms: | |
| Stage: | Day 4 |
Expression Detail
Antibody Labeling
Phenotype Data
Phenotype Detail
Acknowledgments
This image is the copyrighted work of the attributed author or publisher, and
ZFIN has permission only to display this image to its users.
Additional permissions should be obtained from the applicable author or publisher of the image.
Full text @ Dev. Dyn.