
Fig. 8
- ID
- ZDB-FIG-100429-103
- Publication
- Das et al., 2010 - A forward chemical screen in zebrafish identifies a retinoic acid derivative with receptor specificity
- Other Figures
- All Figure Page
- Back to All Figure Page
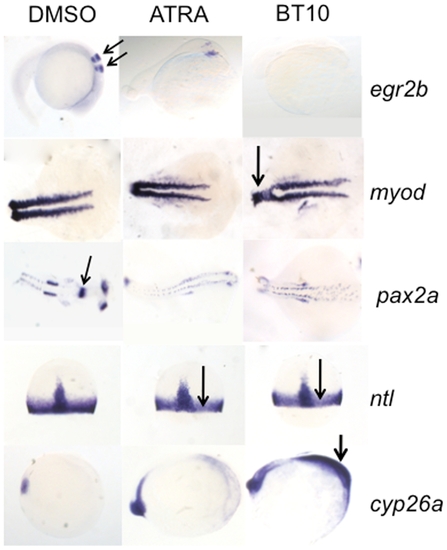
Changes in the expression patterns for known retinoid target genes confirm that BT10 is a retinoid agonist. Shown are representative embryos (n = 30) treated with vehicle (DMSO, left panels), 0.1 μM ATRA (middle panels), or 5 μM BT10 (right panels) and then analyzed by in situ hybridization at the 10 somite stage (cyp26a), 75% epiboly (ntl), the 18 somite stage (myod and pax2a), or the 26 somite stage (egr2b). Embryos are viewed laterally with anterior to the right (egr2b, cyp26a), dorsally with anterior to the right (myod, pax2a), or dorsally with animal pole to the top (ntl, arrows in both panels). Note that in both ATRA and BT10 treated embryos, the normal anterior expression domains are largely abolished (egr2b, arrows indicate normal expression pattern marking the 3rd and 5th rhombomeres in the hindbrain of control embryos, and pax2a, arrow indicates normal expression pattern in the midbrain-hindbrain boundary domain), highly reduced (myod, disruption noted by arrow in BT10 panel), or more subtly inhibited (ntl, indicated by arrows in both panels). In contrast, the expression domain of cyp26a is expanded in BT10-treated embryos throughout the anterior region (arrow in BT10 panel). |
| Genes: | |
|---|---|
| Fish: | |
| Conditions: | |
| Anatomical Terms: | |
| Stage Range: | 75%-epiboly to Prim-5 |