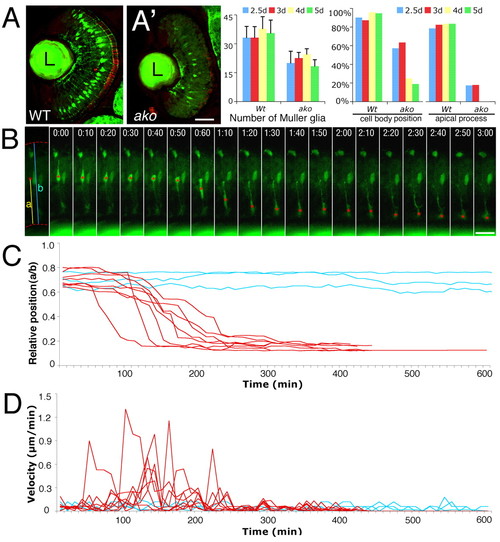
The phenotype of Müller glia. (A,A′) Transverse cryosections through the retinae of wild type (A) and akojj50 mutant (A′) lines at 60 hpf. Müller glia are visualized by Tg(gfap:GFP) transgene expression. Graphs to the right show the quantitation of these phenotypes. `Cell body position′ refers to the position of Müller cell bodies in the inner nuclear layer. (B) A series of images from a time-lapse recording of a mutant Müller cell. Time is indicated above each image in hours and minutes (h:min). Cell body positions are indicated with red asterisks. (C) Cell body position expressed as a ratio of its distance from the inner limiting membrane (parameter `a′ in B) and retinal thickness (parameter `b′ in B). Cell body positions during time-lapse recording sessions are plotted for three wild-type (blue) and eight mutant (red) cells. All data were collected from the peripheral retina from 72-96 hpf. (D) The velocity of perikaryal displacement calculated for the same set of cells as in C. L, lens. Scale bars: 40 μm in A,A′; 20 μm in B.
|
