
Fig. 4
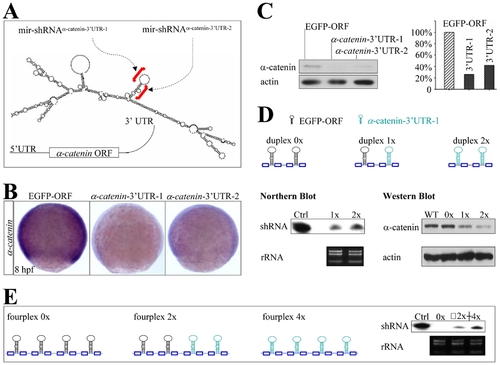
Knockdown of endogenous α-catenin expression. (A) Diagram of mir-shRNAα-catenin-3′UTR-1 and mir-shRNAα-catenin-3′UTR-2 against the 3′UTR of α-catenin gene, whose predicted secondary structure was shown at the bottom. Red brackets denoted the targeted regions. (B) WISH analysis of α-catenin expression in the 8 hpf embryos injected with 160 pg of either shRNAEGFP-ORF, shRNAα-catenin-3′UTR-1 or shRNAα-catenin-3′UTR-2 mRNAs. (C) Quantitative Western blot analysis of α-catenin protein in 22 hpf embryos injected with shRNAs shown in panels B (5 embryos for each lane). (D) Diagram of mir-shRNA duplexes carrying two copies of shRNAEGFP-ORF (duplex 0x), one copy for each shRNAEGFP-ORF and shRNAα-catenin-3′UTR-1 (duplex 1x), and two copies of shRNAα-catenin-3′UTR-1 (duplex 2x). Northern and Western blot analyses of 22 hpf embryos injected with shRNAs 0x, 1x or 2x as shown at the bottom (100 embryos for each line). The ribosomal 5S RNA and β-actin was used as a loading control, respectively. (E) Diagram of mir-shRNA fourplexes carrying four copies of shRNAEGFP-ORF (0x), two copies for each shRNAEGFP-ORF and shRNAα-catenin-3′UTR-1 (2x), and four copies of shRNAα-catenin-3′UTR-1 (4x). Northern blot analysis of 22 hpf embryos injected with shRNAs 0x, 2x or 4x (100 embryos for each line). The ribosomal RNA was used as a loading control. |