|
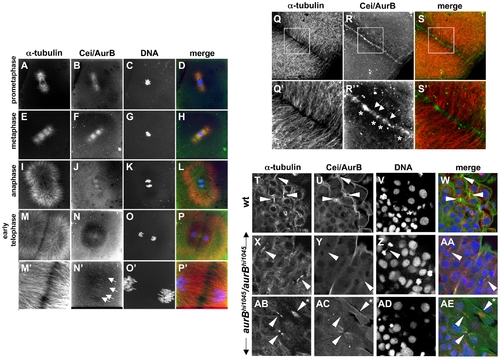
Subcellular localization of Cei/AurB protein. (A–S) Localization of Cei/AurB protein in the early embryo. Animal views of fixed wild-type embryos labeled to detect microtubules, Cei/AurB protein and DNA. (A–P) Series of images detailing the progression of the spindle during the cell cycle as indicated. During prometaphase and metaphase, Cei/AurB protein colocalizes with the forming asters (A–D) and spindles (E–H). During anaphase (I–L), Cei protein remains localized to astral microtubules and the spindle, although localization to the latter appears to subside. During telophase (M–P), Cei/AurB protein transitions to the furrow proper, where it begins to form a ladder-like pattern of short filaments perpendicular to the plane of the furrow (arrows in N′). Panels M′–P′ are 3x magnifications of M–P. (Q–S) During furrow maturation in cytokinesis (shown in this embryo during completion of the first cell division cycle at 38 min p.f.), Cei protein further accumulates along the length of the furrow as punctate aggregates (asterisks in R′) or short filaments perpendicular to the furrow (arrows in R′). These accumulations correspond to sites of microtubule bundling (compare to Q′,S′). Panels Q′–S′ are 3x magnifications of Q–S. All described sites of Cei localization are absent in control labelings using preimmune serum (not shown). (T–AE) Colocalization of Cei/AurB protein to midbodies in fixed 15-somite (16 hours p.f.) embryos. (T–W) Field of cells in a wild-type embryo, showing midbody-like structures (arrowheads in T,U,W). (X–AA, AB–AE) Fields of cells in hi1045 homozygous mutant embryos. Midbody-like structures are present (arrowheads in X,Y,AA,AB,AC,AE) but exhibit reduced levels of Cei/AurB colocalization and often exhibit a splayed, less compact structure (asterisk in AB,AE). In some cases, DNA bridges can also be observed (arrowhead in Z).
|