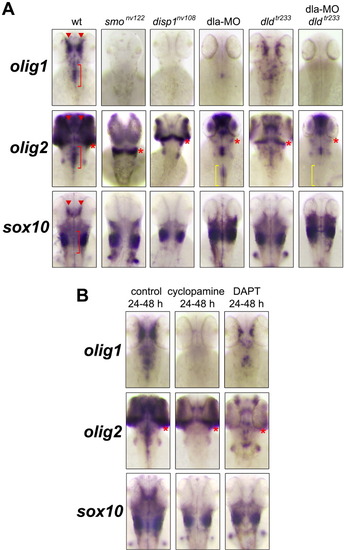
Initiation of olig1 expression depends on hedgehog and notch signaling. A: Hedgehog pathway mutants showed no olig1 expression at 48 hpf and greatly reduced olig2 expression in oligodendrocytes. Also sox10 expression in the brain of hedgehog mutants is absent. DeltaA knockdown animals had little olig1 expression at 52 hpf but still strong olig2 expression and deltaD mutant embryos (dldtr233) showed some reduction of olig1, olig2, and sox10 expression. Compound DeltaA knockdown/deltaD mutant embryos showed no olig1 expression at 52 hpf and greatly reduced olig2 expression in the anterior spinal cord (yellow bracket). B: 100 μM cyclopamine treatment from 24-48 hpf abolished olig1 and sox10 expression in oligodendrocytes and greatly reduced olig2 expression as compared to control treated animals. DAPT treatment (100 μM) from 24-48 hpf significantly reduced but did not abolish olig1, olig2, or sox10 expression. Red bracket marks location of hindbrain oligodendrocytes and red asterisks mark location of cerebellum. Red arrowheads indicate location of midbrain oligodendrocytes.
|
