
Fig. 5
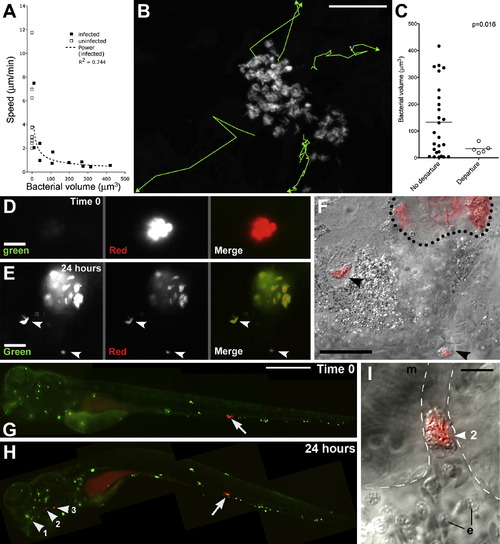
Motility and Departure of Infected Granuloma Macrophages (A) Average speeds of infected and uninfected cells versus their bacterial volumes. (B) Tracks of departing infected macrophages from Movie S11. Scale bar, 50 μm. (C) Bacterial volumes and average speeds of departing macrophages in (B), compared to those that did not depart. p by Student's t test. (D–F) Departure of infected macrophages from brain granuloma. (D) Granuloma immediately after photoactivation (red) and (E) 24 hr later, demonstrating granuloma growth and departure of infected macrophages (arrowheads). (F) DIC/red fluorescence overlay of departing macrophages (arrowheads). Dotted line represents granuloma edge. Scale bars in (D)-(F), 20 μm. (G–I) Hematogenous dissemination from tail granuloma. (G) A single granuloma (arrow) photoactivated at 3 dpi. Scale bar, 300 μm. (H) At 4 dpi, photoactivated bacteria (arrowheads) seen in gill vasculature. (I) DIC image of cluster #2 from (H). Dashed line: limits of vasculature, e: erythrocyte, m: muscle. Scale bar, 10 μm. |
Reprinted from Cell, 136(1), Davis, J.M., and Ramakrishnan, L., The role of the granuloma in expansion and dissemination of early tuberculous infection, 37-49, Copyright (2009) with permission from Elsevier. Full text @ Cell