
Fig. 2
- ID
- ZDB-FIG-080909-16
- Publication
- Komisarczuk et al., 2008 - Enhancer detection and developmental expression of zebrafish sprouty1, a member of the fgf8 synexpression group
- Other Figures
- All Figure Page
- Back to All Figure Page
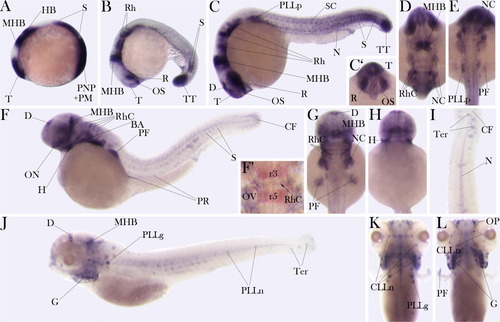
In situ hybridization with spry1 antisense probe on wild-type embryos. A-L: At the 2-somite stage (A), 18-somite stage (B), 22 hours postfertilization (hpf; C-E,F′), 48 hpf (F-H), and 120 hpf (I-L). A-C,F,I,J: Lateral view, anterior to the left (I, anterior to the bottom); C′,H,L: ventral view, anterior to the top; D,E,F′,G,K: dorsal view, anterior to the top. spry1 expression domains are similar to the fgf8a expression pattern. Note in F′ (spry1-blue, ephA4-red marks r3 and r5) that rhombomere expression is not in register with rhombomere boundaries, but rather corresponds to rhombomere centers. BA, branchial arches; CF, caudal fin fold; CLLn, cranial lateral line neuromasts; D, dorsal diencephalon; G, gills, H, hyoid; HB, hindbrain; MHB, midbrain-hindbrain boundary; N, notochord; NC, neural crest; ON, optic nerve; OP, olfactory placodes; OS, optic stalk; OV, otic vesicle; PF, pectoral fin; PLLg, posterior lateral line ganglion; PLLn, posterior lateral line neuromasts; PLLp, posterior lateral line primordium; PM, paraxial mesoderm; PNP, posterior neural plate; PR, pronephros; S, somites; SC, spinal cord; R, retina; Rh, rhombomeres; RhC, rhombomere centers; T, telencephalon; Ter, terminal neuromasts; TT, tail tip. |