
FIGURE
Fig. 3
- ID
- ZDB-FIG-080909-17
- Publication
- Komisarczuk et al., 2008 - Enhancer detection and developmental expression of zebrafish sprouty1, a member of the fgf8 synexpression group
- Other Figures
- All Figure Page
- Back to All Figure Page
Fig. 3
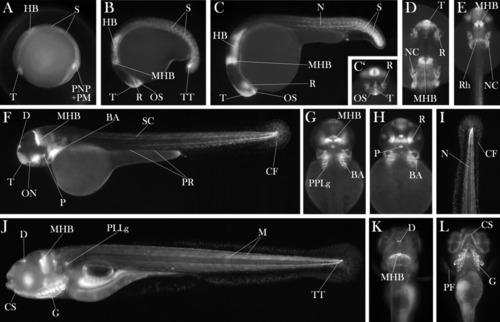
YFP expression pattern in CLGY786 line mimics endogenous spry1. A-L: At the 2-somite stage (A), 16-somite stage (B), 22 hours postfertilization (hpf; C-E), 48 hpf (F-H), and 120 hpf (I-L). A-C,F,I,J: Lateral view, anterior to the left (I, anterior to the bottom); C′,H,L: ventral view, anterior to the top; D,E,G,K: dorsal view, anterior to the top. P, pituitary; CS, craniofacial skeleton; M, muscle. For other abbreviations, see Figure 2. |
Expression Data
Expression Detail
Antibody Labeling
Phenotype Data
Phenotype Detail
Acknowledgments
This image is the copyrighted work of the attributed author or publisher, and
ZFIN has permission only to display this image to its users.
Additional permissions should be obtained from the applicable author or publisher of the image.
Full text @ Dev. Dyn.