|
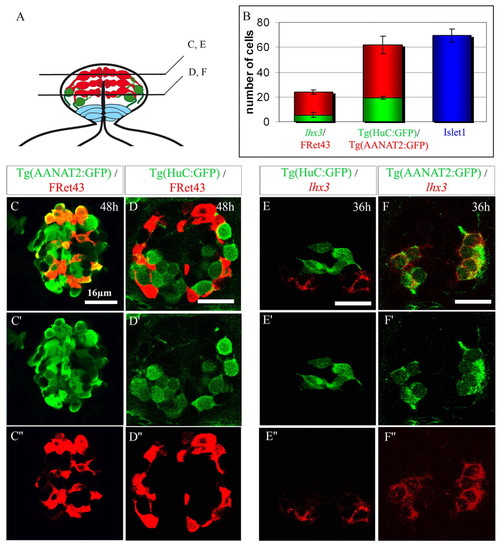
Characterization of the two categories of epiphysial neurons. (A) Schematic diagram of the epiphysial vesicle in frontal section. Dorsal is upwards. The photoreceptors (in red) lie dorsally and medially compared with the more ventrolateral projection neurons (in green). Ventrally located neuroepithelial cells are in light blue. (B) Average numbers of cells positive for markers of projection neurons (green) or photoreceptors (red) and total number of Islet1+ neurons (blue). A minimum of three embryos were analyzed for each stage. Error bars represent the standard deviation. (C-F″) Confocal sections of the epiphysis from Tg(AANAT2:GFP) (C-C″,E-E″) and Tg(HuC:GFP) transgenic embryos (D-D″,F-F″) labeled at 48 hours with the photoreceptor marker FRet43 or at 36 hours with the projection neurons marker lhx3. Anterior is upwards. Scale bars: 16 μm.
|