|
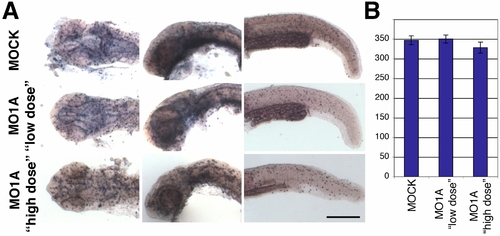
appl1 morphants show no significant differences in cell proliferation.
(A) Zebrafish embryos injected with injection buffer only (MOCK), 8 ng („low dose“) or 12 ng („high dose“) MO1A, immunostained with anti-P-Histone H3 antibodies (in purple) to highlight mitotic cells. Top and side views of heads and side views of tails are shown (from the left to the right). Scale bar: 250 μm.
(B) Quantification of anti-P-Histone H3 labeled cell in zebrafish heads (including midbrain hindbrain boundary) as shown in (A), left panels. 5 heads per genotype have been evaluated. Error bars indicate standard deviation. Despite the occurring apoptosis (see Figure 4), no significant changes in the number of mitotic cells were found (P values > 0,15).
|