
Fig. 3
- ID
- ZDB-FIG-080411-55
- Publication
- Donizetti et al., 2008 - Differential expression of duplicated genes for prothymosin alpha during zebrafish development
- Other Figures
- All Figure Page
- Back to All Figure Page
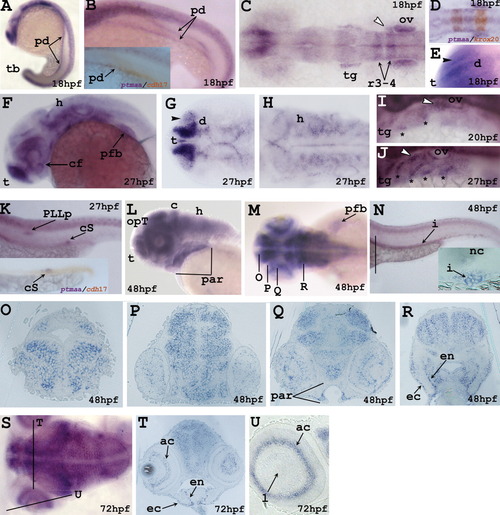
In situ localization of ptmaa at indicated stages. A,F,L: Lateral view of embryo. C,G,H,M,S: Dorsal view of the embryo. B,K,N: Tail region of the embryo. The insets in B and in K are double in situ hybridizations for ptmaa and cdh17. D: Double in situ hybridizations for ptmaa and krox20. E: Higher magnification of the head region. I,J: Detail of the trunk region of the embryo. N: The black line indicates the position of the transverse section shown in the inset. O-R: Transverse sections indicated by the black lines in M. T,U: Transverse and longitudinal sections indicated by the black lines in S. White arrowhead, the anterior lateral line placode; black arrowhead, the olfactory placode; black asterisks, the endodermal pouches. ac, amacrine cells; c, cerebellum; cf, chorioid fissure; cS, corpuscle of Stannius; d, diencephalon; ec, ectoderm; en, endoderm; h, hindbrain; i, intestine; l, lens; nc, notochord; opT, optic tectum; ov, otic vesicle; par, pharyngeal arches region; pd, pronephric ducts; pfb, pectoral fin bud; PLLp, posterior lateral line precursor; r, rhombomere; t, telencephalon; tb, tailbud; tg, trigeminal ganglion. |