|
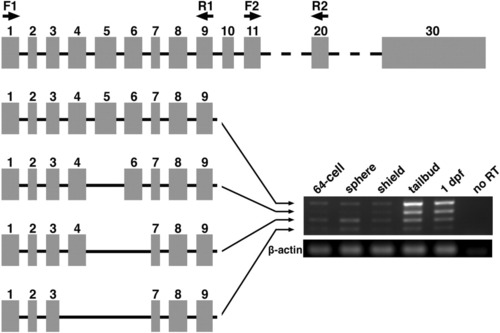
Temporal expression pattern and exon organization of four calpastatin splice variants. Semiquantitative reverse transcriptase (RT) -polymerase chain reaction using cast F1 and R1 primers was used to determine the relative abundance of four cast transcripts at 64-cell, sphere, shield, bud, and 1 day postfertilization (dpf). One representative no template control (no RT) is shown and β-actin was used as a loading control. Schematic representation of exon organization is shown for each of the four transcripts. cast F1 and R1 primers amplify exons 1-9 and F2 and R2 amplify exons 11-20 as indicated. cast F2 and R2 amplify a single product (see Fig. 3).
|