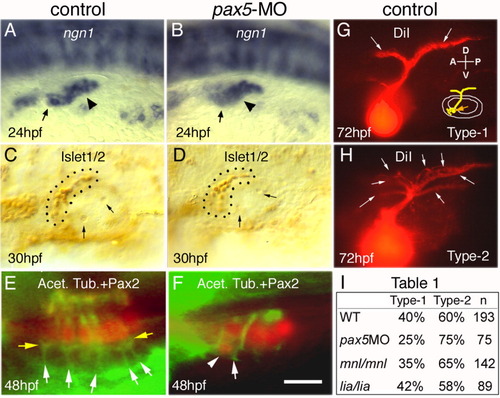
Development of the statoacoustic ganglion (SAG). A,B: Expression of ngn1 in the otic vesicle (arrowheads) and SAG (arrows) in a control embryo (A) and pax5-morphant (B) at 24 hours postfertilization (hpf). C,D: Anti-Islet-1/2 staining of SAG neuroblasts (outlined) at 30 hpf. An average of 16.5 ± 4.2 neuroblasts were detected in control embryos (C) compared with 15.7 ± 3.5 in pax5 morphants (D). Arrows mark otoliths. E,F: Utricular maculae of a 48 hpf control embryo (E) and pax5 morphant (F), showing acetylated tubulin (green) relative to Pax2 in hair cell nuclei (red). White arrows in E mark axonal process projecting to hair cells and broader regions of staining (yellow arrows) are observed at the basal regions of hair cells, possibly associated with synapses. Specimen in F shows a misplaced hair cell (arrowhead) associated with a single thick SAG process (arrow). G,H: Central projections of SAG neurons visualized by injecting DiI (1,1-dioctadecyl-3,3,3,3 -tetramethylin-docarbocyanine perchlorate) into the utricular macula at 72 hpf. Schematic in G shows the site of DiI injection (orange arrow) and SAG projections relative to the ear. Wild-type larvae show either two discrete axonal bundles in the hindbrain (G, type-1) or more diffuse projection patterns (H, type-2), including smaller secondary branches indicated by arrows. I: Table 1, percentage of larvae showing type-1 or type-2 projection patterns in control embryos, pax5 morphants, mnl/mnl mutants, and lia/lia mutants. A-K: Images show dorsolateral (A,B,E,F), dorsal (C,D), and lateral (G-K) views, with anterior to the left. Scale bar = 50 μm in A,B,E,F, 30 μm in C,D, 12.5 μm in G-K.
|
